Journalist Resource October 13, 2026
How We Investigated the Impacts of Critical Minerals in the Amazon
Country:

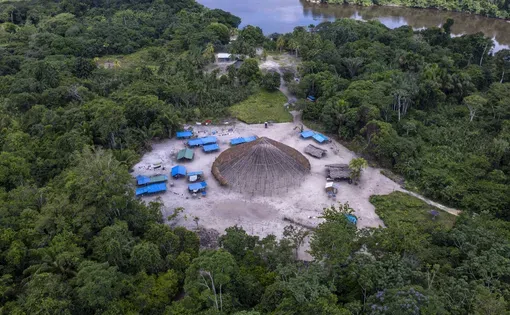
The socio-environmental impacts of the extraction of critical minerals in the Amazon

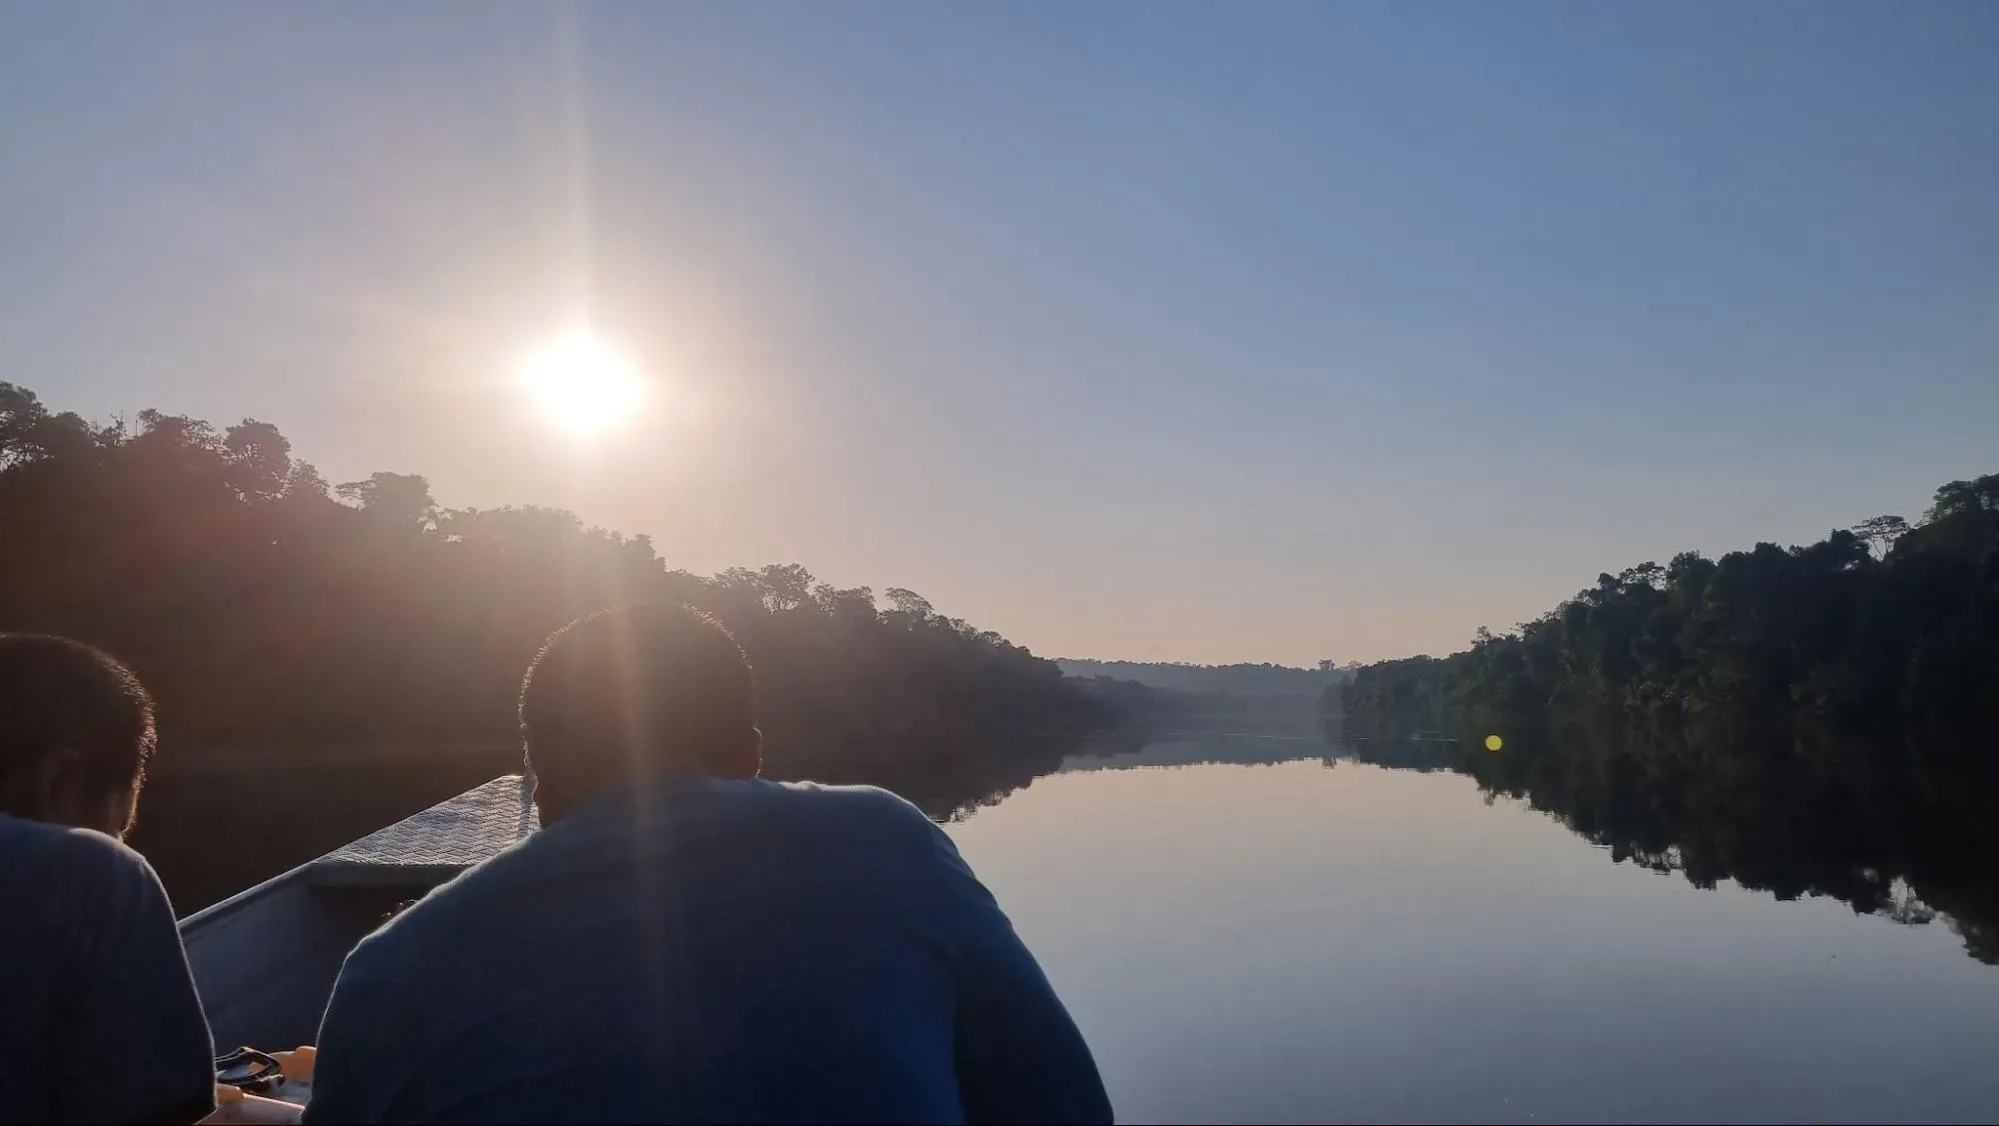
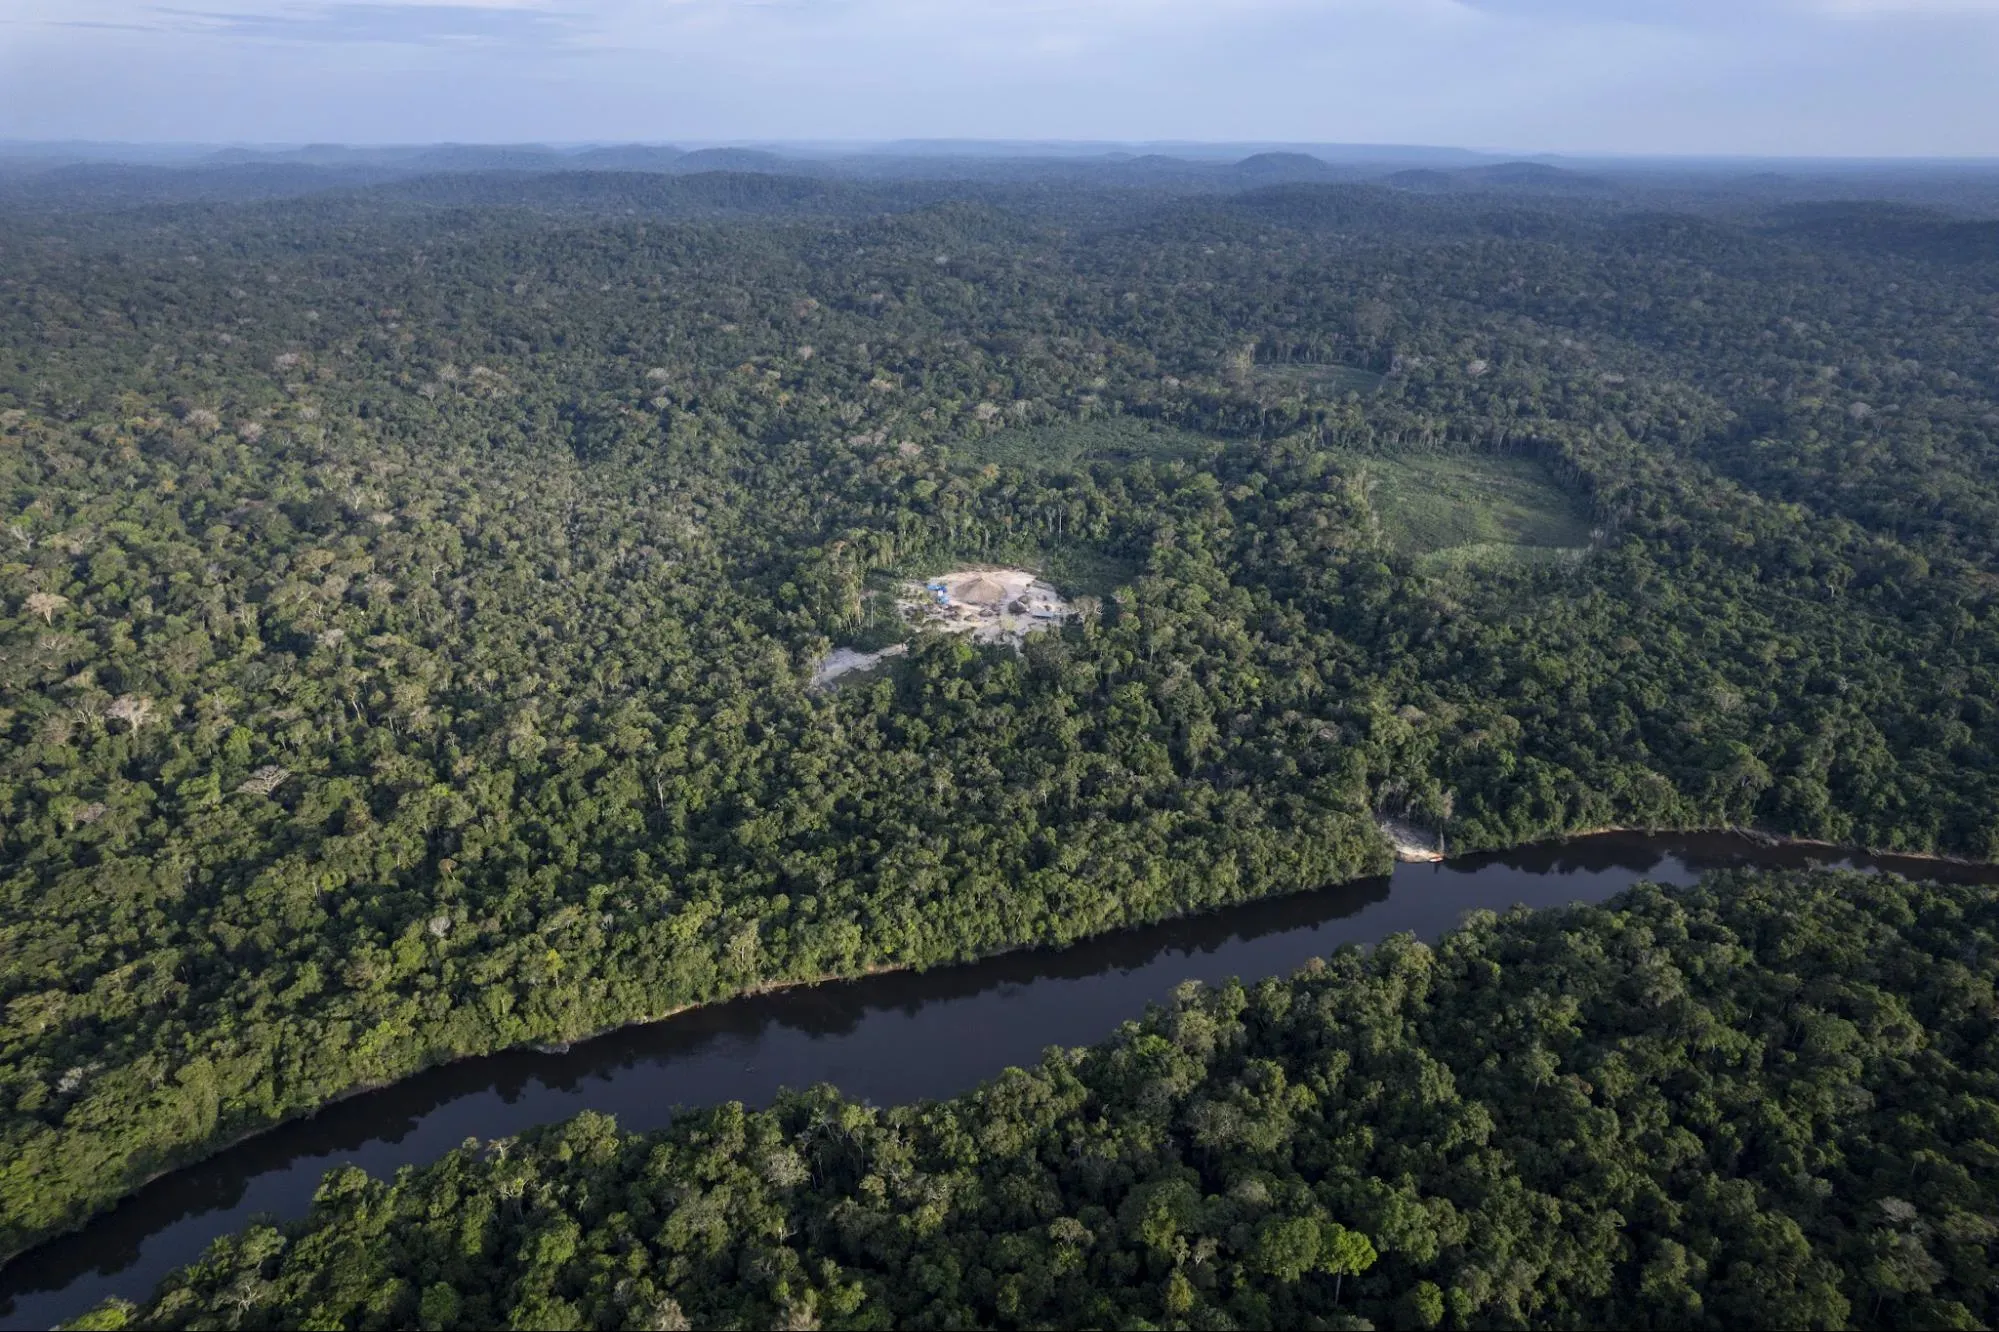
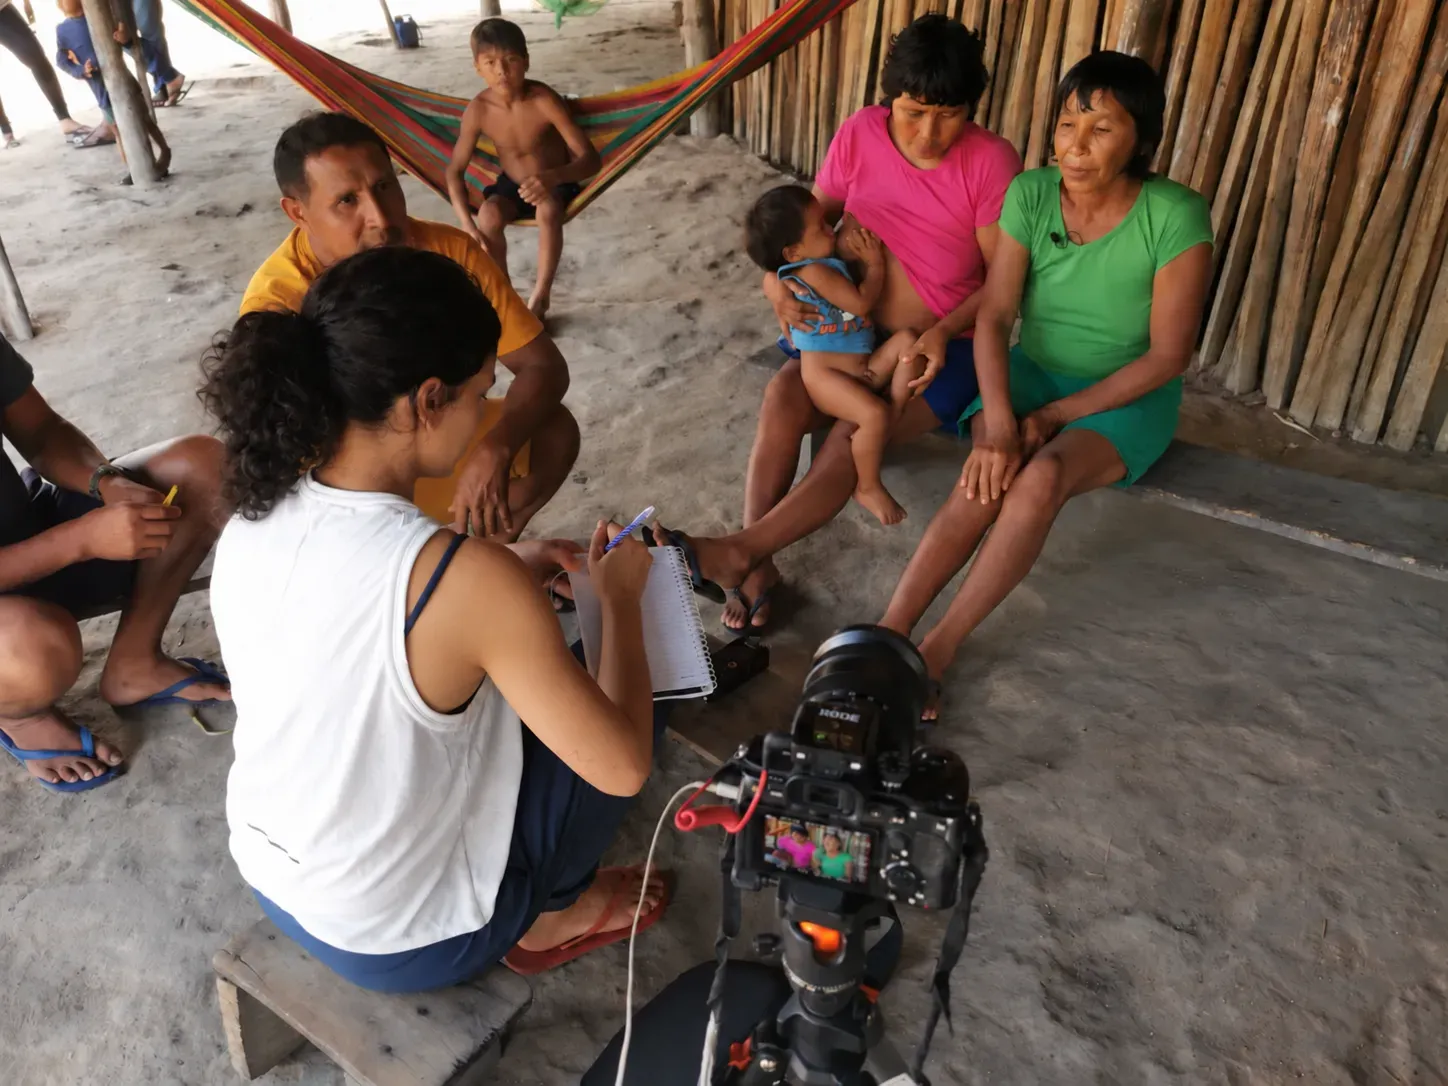
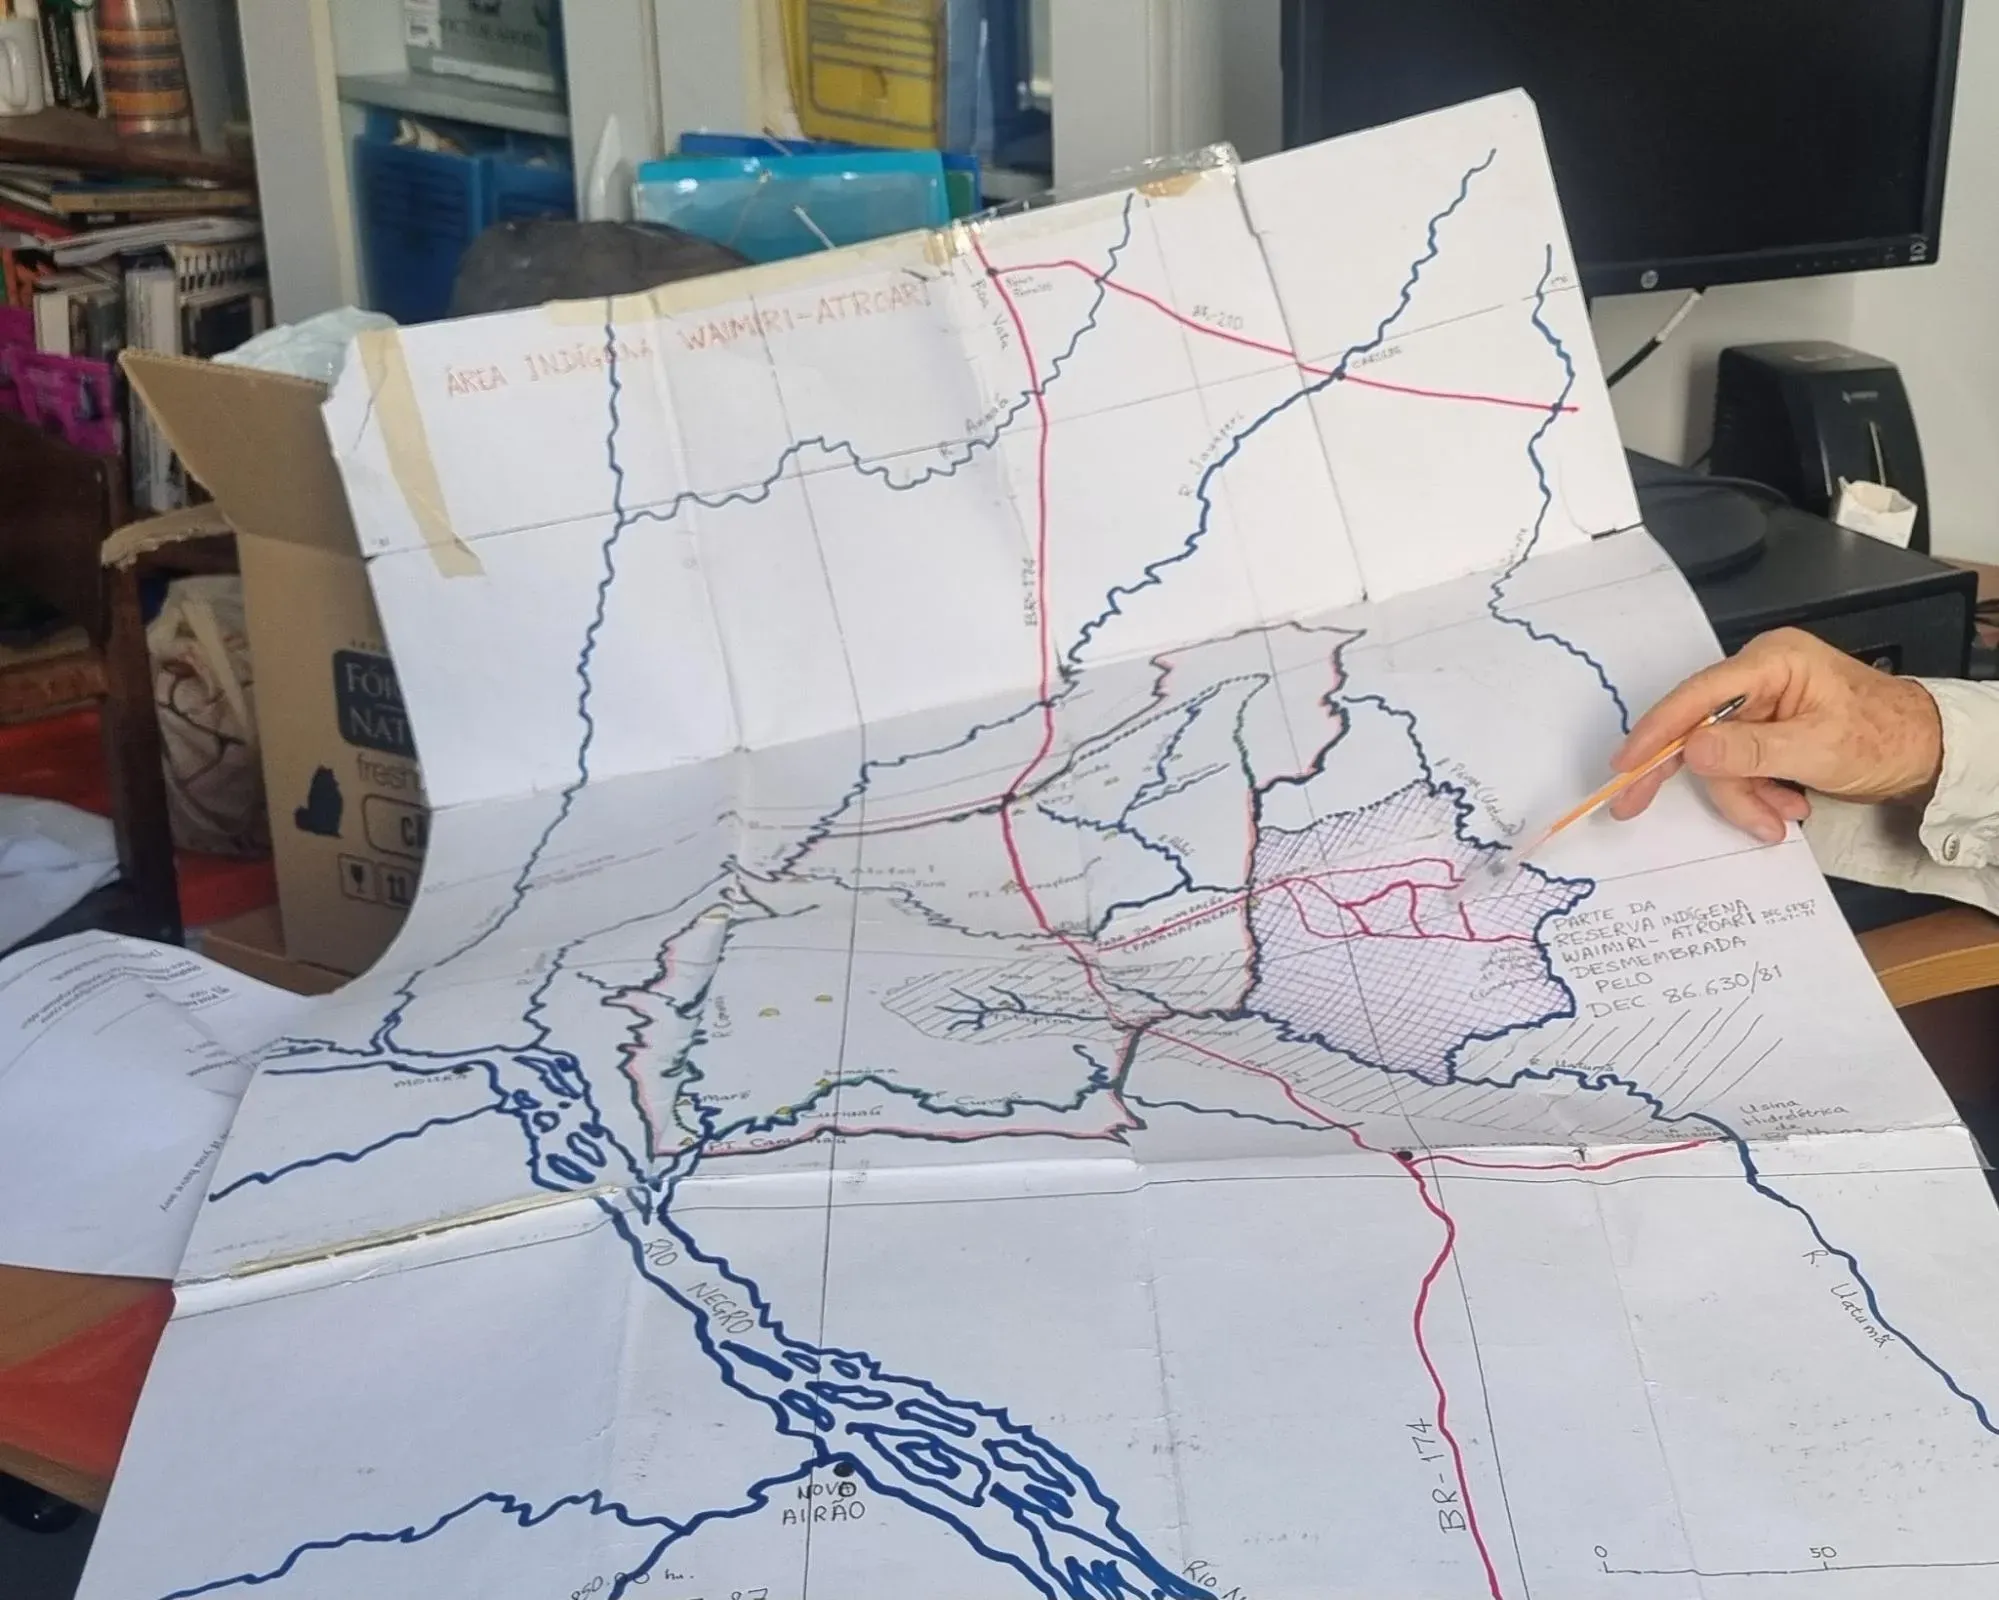
The Alalaú River is one of the most beautiful places I have ever seen. Its waters are dark blue and its bed is dotted with waterfalls and enormous rocks. Macaws fly back and forth overhead. The river runs through the Waimiri Atroari Indigenous Territory, home to 2,000 Indigenous people in the Brazilian Amazon.
But today, the Indigenous people are afraid of the river. During the rainy season, the Alalaú turns muddy and smells bad, carrying toxic waste from a company that mines critical minerals. When I traveled along the river, I heard older women describe their fear of letting their grandchildren play in the water. I heard concerns about the future: Whether the river will continue to provide fish safe to eat and water that’s safe to drink.
Months later, immersed in spreadsheets, corporate documents and customs data, I discovered that tin produced by Mineração Taboca, the mining company suspected of contaminating the Indigenous territory, had entered the supply chains of two major automakers: Toyota and Tesla.
The reporting series The Tech Supply Chain in the Amazon is the result of a year-long investigation into the impacts of critical mineral extraction in the Amazon and its connections to major tech companies. The work combined months of research in databases and documents, plenty of trial and error with the free spatial visualization tool QGIS, conversations with the Waimiri Atroari, and a field reporting trip planned with patience and care.

As a nonprofit journalism organization, we depend on your support to fund more than 170 reporting projects every year on critical global and local issues. Donate any amount today to become a Pulitzer Center Champion and receive exclusive benefits!
This rush for minerals is also spreading into other territories. During the project, we published stories about a company seeking to mine rare earths in a Quilombola territory (settlements established by Afro-Brazilians escaping slavery before the abolition in 1988), the expansion of mining interests into the territories of isolated Indigenous peoples, and a lithium mining company that describes itself as “zero carbon” and is linked to a land-grabbing case.
In this methodology, I explain how we combined documentary research, map analysis, international trade data, and work with Indigenous and Quilombola communities to connect the impacts of the mineral rush in the Amazon to the supply chains of major tech companies.
Hypothesis
My hypothesis was that the rush for critical minerals used by the tech industry, and considered strategic for the energy transition, was increasing pressure on Indigenous lands, conservation areas, Quilombola territories, and agrarian reform settlements in the Amazon. I wanted to investigate how government investments to enable mineral extraction were not considering the impact on these territories. I also wanted to trace minerals extracted in these areas and see if they enter the supply chains of major tech companies.
Methodology
- Mapping mining applications and territories
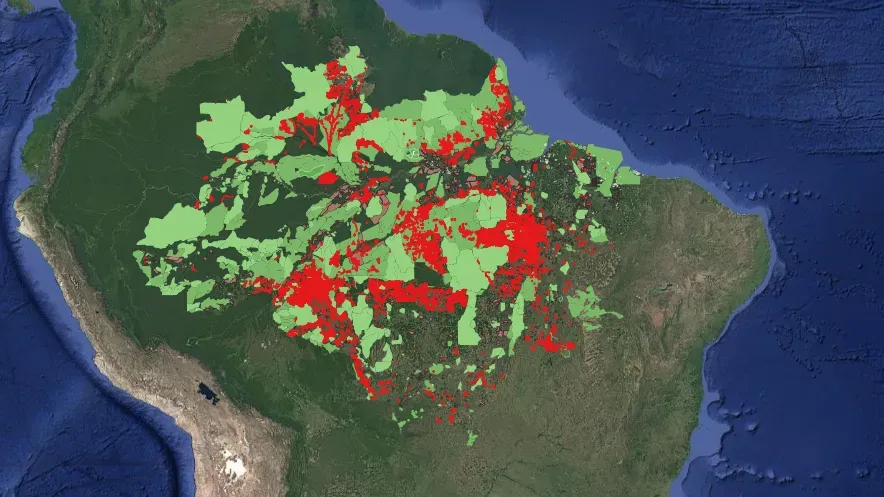
Our first step was to build a map of the Legal Amazon showing critical mineral mining license applications and their overlap with Indigenous lands, conservation areas, Quilombola territories, and agrarian reform settlements.
We used the overlay tool in QGIS to identify where these protected lands and traditional communities were affected by these mining applications. In addition to direct overlaps, we wanted to see if there were any of these lands in 10 km zones around the mining application areas. According to the Interministerial Ordinance No. 60 of 2015 there should be a 10 km boundary around projects subject to environmental licensing.
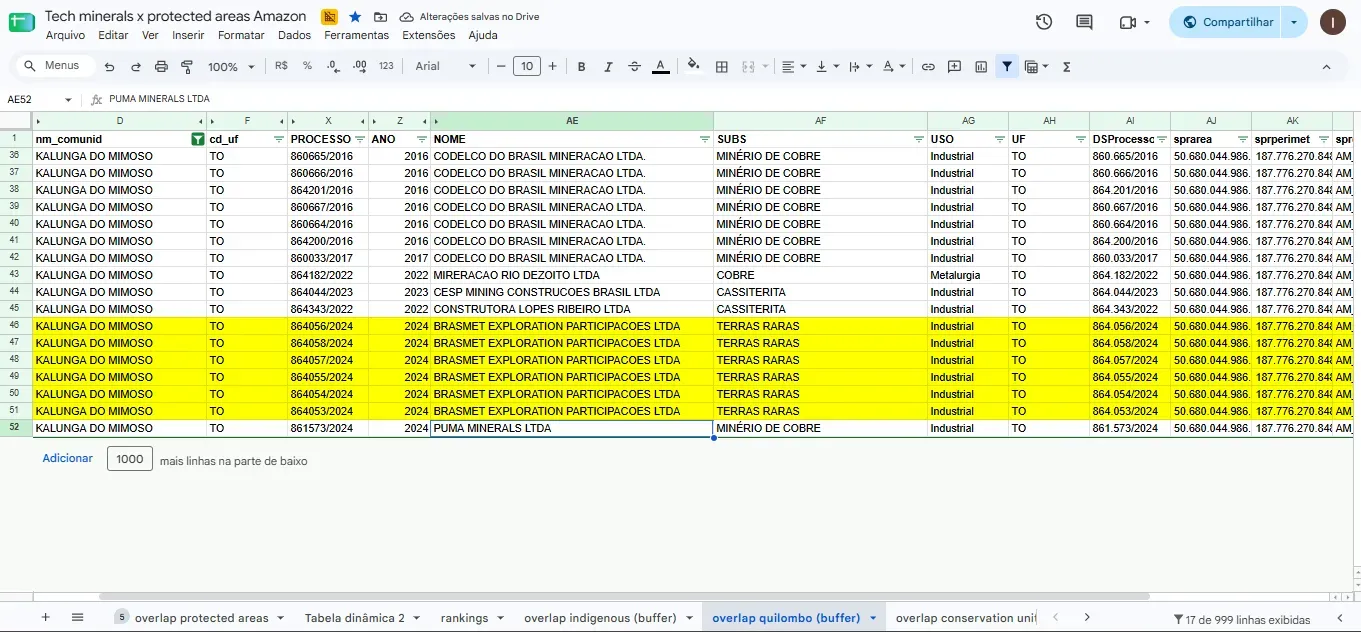
In this initial analysis, we found 8,500 critical mineral mining applications at various stages and identified the affected territories: 171 Indigenous lands, 257 conservation areas, 25 Quilombola territories, and about 1,200 agrarian reform settlements. We used these results to create a spreadsheet with information on the mining projects and affected territories.
With this map and spreadsheet combination, we could more easily identify what they were planning to mine in which territories. This allowed us, for example, to quickly publish a story about a company planning to mine rare earths in Quilombola territory in Tocantins, just as the issue was gaining attention in the national press.
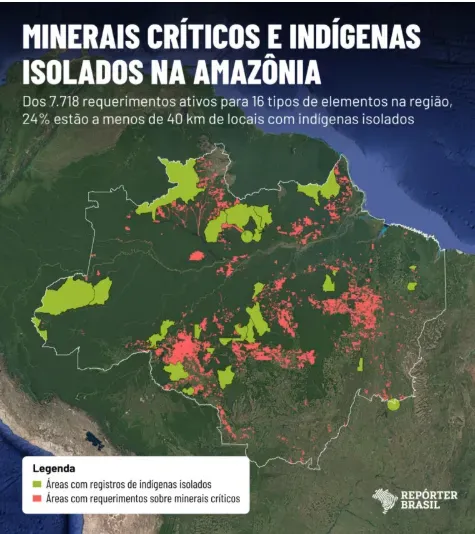
This methodology also allowed us to analyze data provided by partner organizations such as OPI (Observatory for the Human Rights of Indigenous Peoples in Isolation and Recent Contact). In QGIS, we cross-referenced the locations of critical mineral mining applications with areas where the presence of Indigenous peoples in voluntary isolation has been recorded. We found that more than 80% of these peoples are surrounded by applications to mine these substances.
- Investigating companies and individuals
The geographic analysis was the starting point for a series of investigations. Our second step was to investigate the companies and individuals holding mining applications. We examined corporate documents, including annual reports, sustainability reports, investor presentations, and press releases. Many were available on company websites; others were obtained through open-source intelligence techniques, known as OSINT.
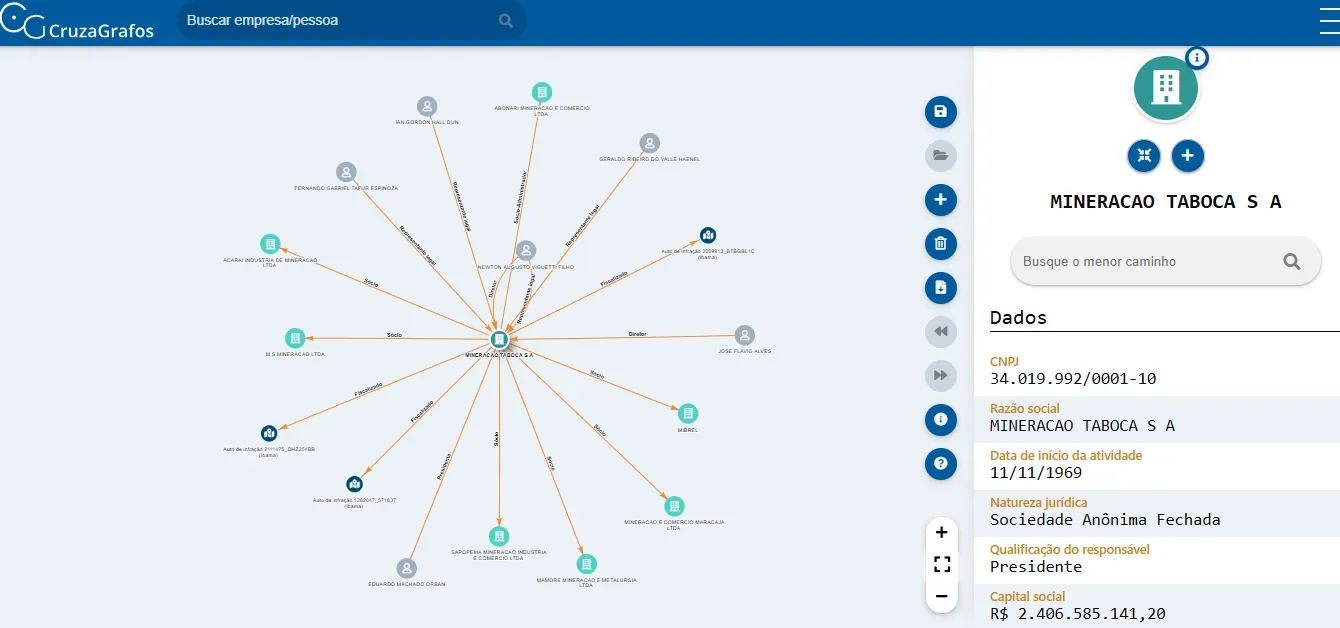
We also consulted CruzaGrafos, a tool from the Brazilian Association of Investigative Journalism (Abraji), the Federal Revenue Service website, and Sayari, an AI platform for economic security and commercial risk, to find information on companies, subsidiaries, and shareholders.
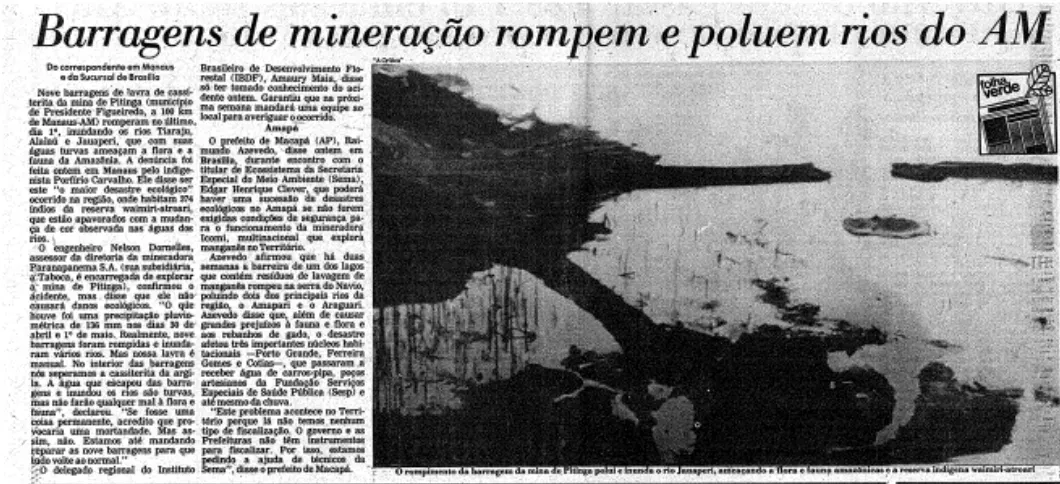
We also investigated the history of social and environmental violations involving these companies and individuals. We searched newspaper archives and platforms run by the Brazilian Institute of Environment and Renewable Natural Resources (Ibama), the Chico Mendes Institute for Biodiversity Conservation (ICMBio), and state environmental agencies and we used Jusbrasil to locate court cases. We also obtained documents from sources at the Federal Public Prosecutor’s Office and nongovernmental organizations.
- Tracing the supply chain
The next step was to investigate which companies were processing and using these minerals. We analyzed customs data on Sayari and global trade databases Abrams and ImportGenius. We also searched for information in corporate documents, such as annual reports and investor presentations.
One example was our investigation, a collaboration with El CLIP, into a lithium mining company linked to a carbon credit project with environmental problems. The company, Sigma, had used credits from this project to offset its emissions. Because the project was under investigation for deforestation and land grabbing in the Amazon, we wanted to find out where the company’s lithium was going.
Our first lead was a press release from Sigma announcing the sale of a shipment of “carbon-neutral” lithium to Yahua Group. We obtained a Yahua sustainability report stating that the company supplied Tesla, BYD and CATL directly. We confirmed these relationships through documents disclosed on the Shenzhen Stock Exchange and a Yahua investor presentation.
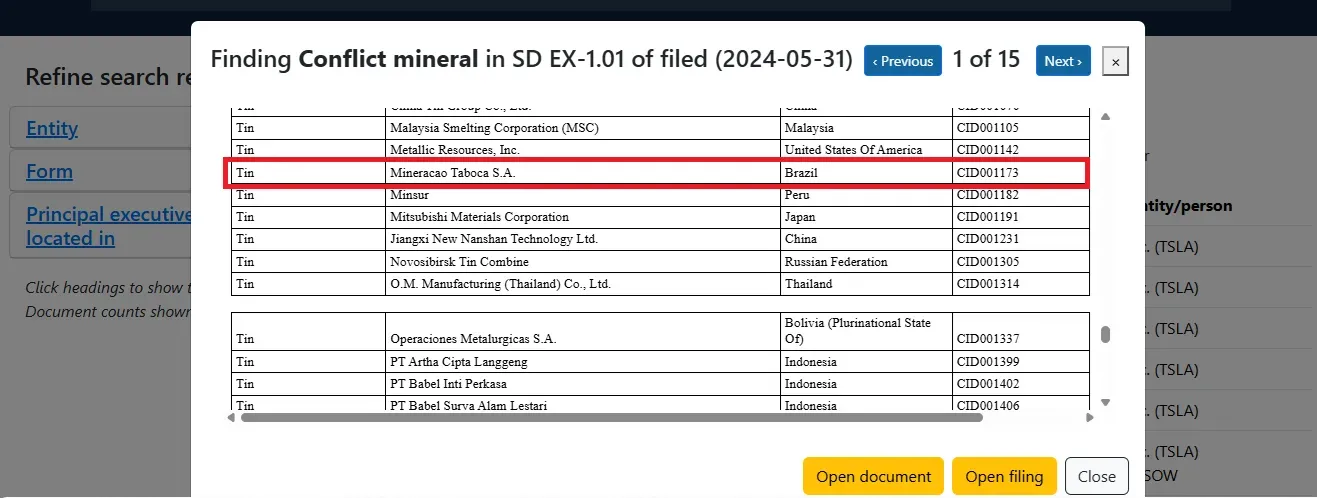
Another useful source were conflict minerals reports, which are public documents filed with the Securities and Exchange Commission (SEC), the U.S. capital markets regulator. In these reports, companies list potential suppliers of four minerals: gold, tin, tantalum-cobalt, and tungsten. Although these are not lists of direct suppliers, they can provide leads for an investigation.
In the Waimiri Atroari investigation, we examined mining company Mineração Taboca. The company has its own refinery and produces tin alloy, allowing us to identify its exports and buyers. Among the direct commercial relationships, we found sales of tin alloys to Toyota operations.
We also looked for indirect connections to major global companies. Documents filed with the SEC cited Taboca as a possible tin supplier in the supply chains of automotive and tech companies such as Alphabet and Tesla. However, this did not prove that tin produced by Taboca had actually reached those companies.
To verify these connections, we mapped those companies’ suppliers and trading partners, again using customs data. We exported the names into spreadsheets and used Apiary, a Pulitzer Center instance of data analysis tool OpenAleph, to cross-reference these lists with Taboca’s buyers. We found that Taboca had sold tin alloys to a company in Slovakia. That same company later exported automotive parts to Tesla in the United States.
Finally, we checked the findings against corporate documents, SEC filings, supplier lists and company statements.
Data and document sources
Georeferenced data on mining applications are available on the website of Brazil’s National Mining Agency. To select the critical minerals, we used the list of 16 substances in Resolution No. 2 of June 18, 2021, which identifies strategic minerals for high-tech products.
We obtained geographic data on the territories from the websites of the public agencies listed in this section.
Geographic data on territories
- Quilombola territories and agrarian reform settlements.
https://certificacao.incra.gov.br/csv_shp/export_shp.py - Indigenous lands.
https://www.gov.br/funai/pt-br/atuacao/terras-indigenas/geoprocessamento-e-mapas - Conservation areas.
https://dados.gov.br/dados/conjuntos-dados/unidadesdeconservacao
Databases and research platforms
- National Mining Agency (ANM) mining records search.These are searchable by application number, substance and company, among other filters. Each case page contains its history and other information useful for reporting.
https://sistemas.anm.gov.br/scm/extra/site/admin/pesquisarprocessos.aspx - Mining Geographic Information System (SIGMINE): mining records in shapefile format.
https://dados.gov.br/dados/conjuntos-dados/sistema-de-informacoes-geograficas-da-mineracao-sigmine - Embargoes and violations recorded by the Chico Mendes Institute for Biodiversity Conservation (ICMBio).
https://www.gov.br/icmbio/pt-br/assuntos/dados_geoespaciais/mapa-tematico-e-dados-geoestatisticos-das-unidades-de-conservacao-federais - Embargoes and environmental violations recorded by the Brazilian Institute of Environment and Renewable Natural Resources (Ibama).
https://dadosabertos.ibama.gov.br/ - CruzaGrafos (Abraji).
https://cruzagrafos.abraji.org.br/ - Brazil’s Federal Revenue Service.
https://solucoes.receita.fazenda.gov.br/Servicos/cnpjreva/ - Jusbrasil.
https://www.jusbrasil.com.br/ - Observatório da Transição Energética
https://observatorio.reporterbrasil.org.br/
We also used customs data from Sayari, Abrams, and ImportGenius; corporate documents; and reports filed with the Securities and Exchange Commission (SEC). We obtained additional data from OPI and documents from sources at Brazil’s Federal Public Prosecutor’s Office and nongovernmental organizations.
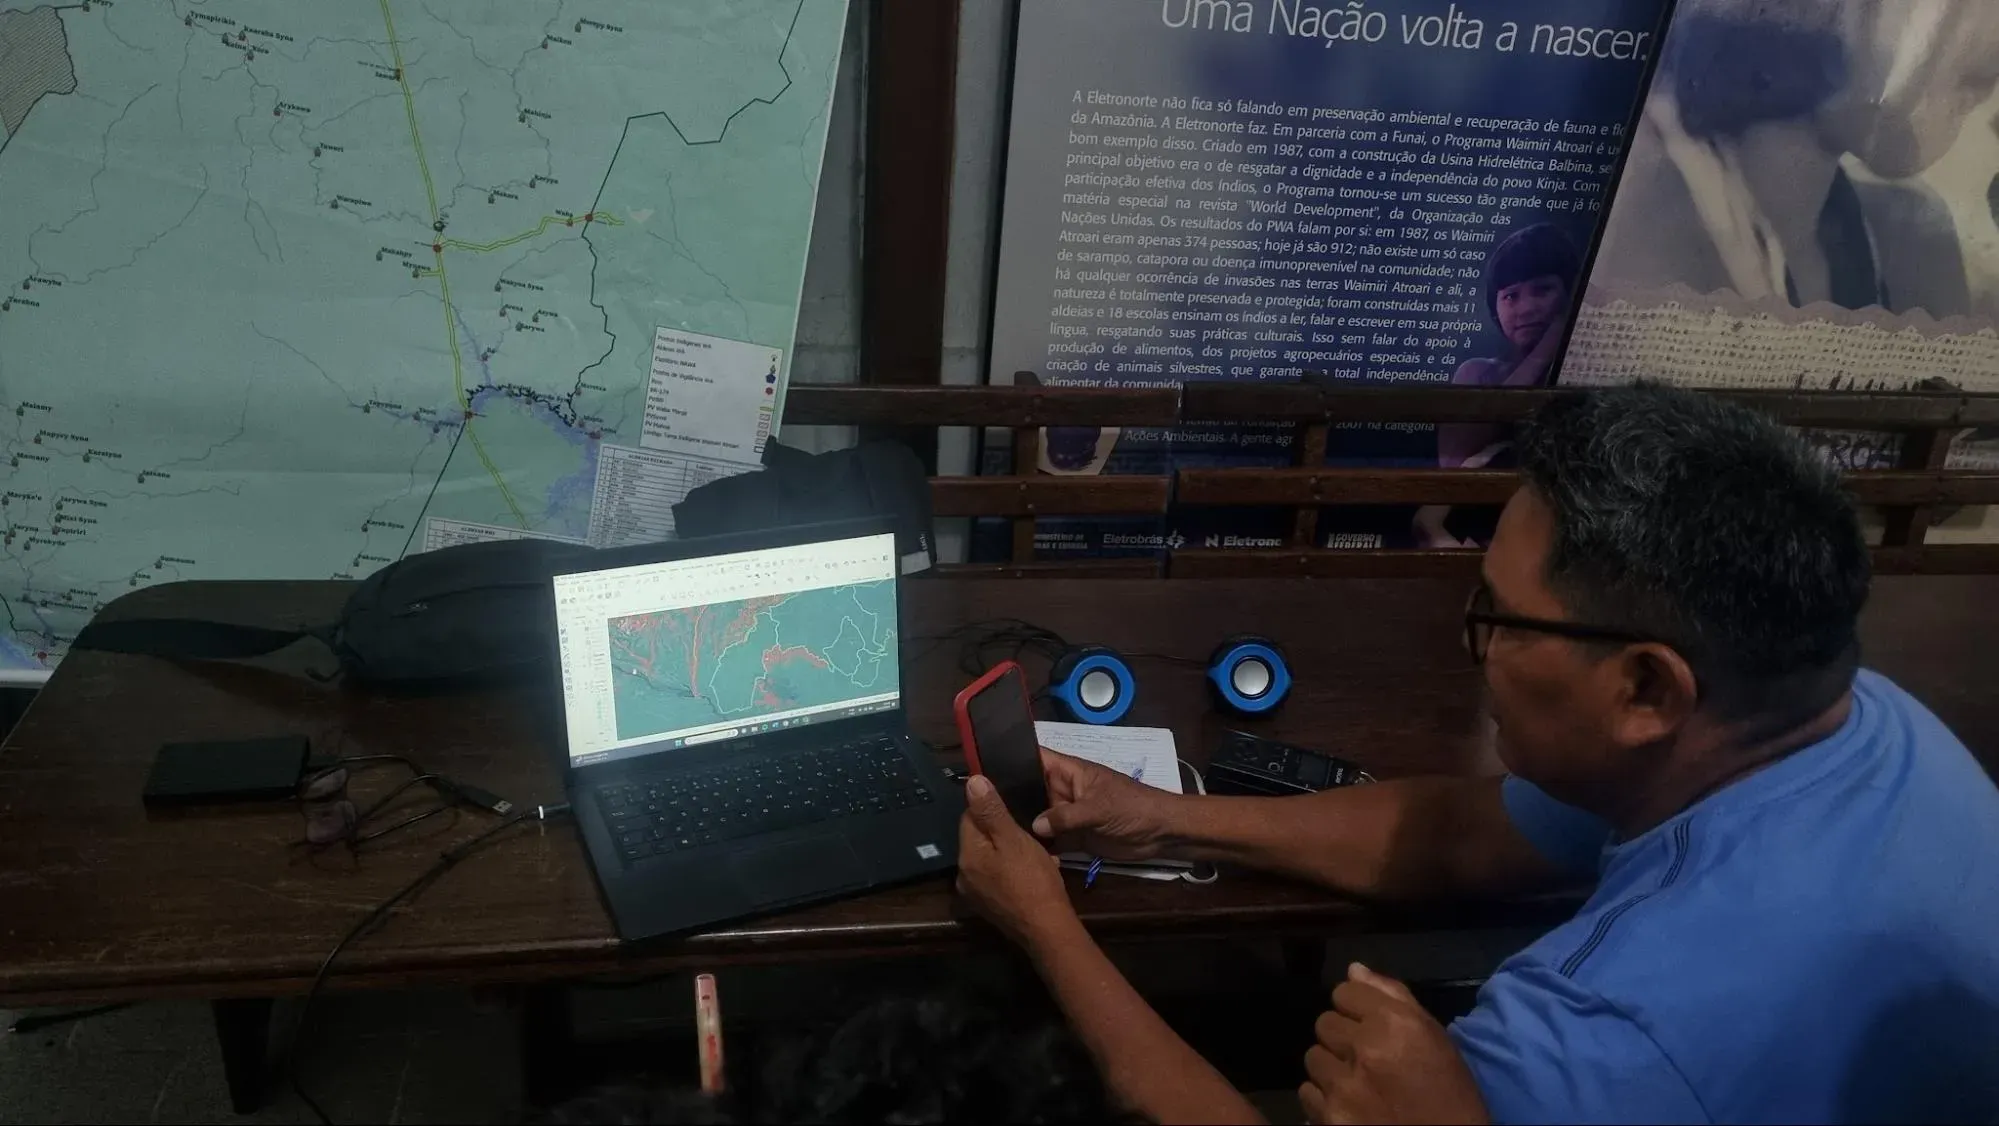
Challenges
One of the main challenges was handling a large volume of data and organizing it in a way that was useful for reporting. We spoke with mining and environmental specialists and fellow journalists to understand the National Mining Agency’s data, identify the most relevant information, and decide how to analyze it in QGIS and then in spreadsheets. Cleaning the data was also important: We needed to identify duplicate results in the spatial analysis and standardize territory names.
Another challenge arose when critical minerals began receiving widespread attention in the Brazilian press during our investigation, initially because of U.S. interest in rare earths. This created demand for stories at a time when the impacts of mineral extraction on these territories were still receiving little attention. We sped up the geographic analysis and began publishing shorter stories focused on specific minerals, such as rare earths and lithium.
How future investigations can learn from this project
This methodology helped us create the Energy Transition Observatory, an interactive map of territories affected by solar and wind energy projects, transmission lines and critical mineral mining projects. Developed by Repórter Brasil with support from the Pulitzer Center's Rainforest Investigations Network and other organizations, the Observatory has been used by journalists and communities affected by these projects.
I have also applied this methodology to investigations into the connections between critical minerals and the defense industry, combining data cross-referencing in QGIS with the steps used to trace supply chains.
To adapt this method to other investigations, journalists can start with a narrower focus, such as a mineral, company, or territory. It is important to record the dates of the datasets and the criteria used to cross-reference them. The map helps identify leads and select cases for further investigation, but reporting also requires documents, conversations with communities and verification of commercial relationships.