Journalist Resource
 May 20, 2025
How We Revealed Mega-Polluters Taking Advantage of Green Loans
Country:


Sasha Chavkin will examine China’s exposure to commodities linked to deforestation, including...
In recent years, banks and corporations have poured trillions of dollars into finance they label as “green” or “sustainable.” Their claims about what this money will achieve sound impressive, but in many cases they amount to empty promises.
For this investigation, we examined a type of green finance called sustainability-linked loans (SLLs). SLLs tend to be massive—think billions of dollars—and they offer companies reduced interest rates if they promise to achieve environmental goals, like cutting carbon emissions or cleaning up supply chains. But unlike other kinds of green finance, the money from the loans doesn’t have to be used for green purposes, and neither the companies nor the banks have to disclose their environmental progress or even their benchmarks for success.
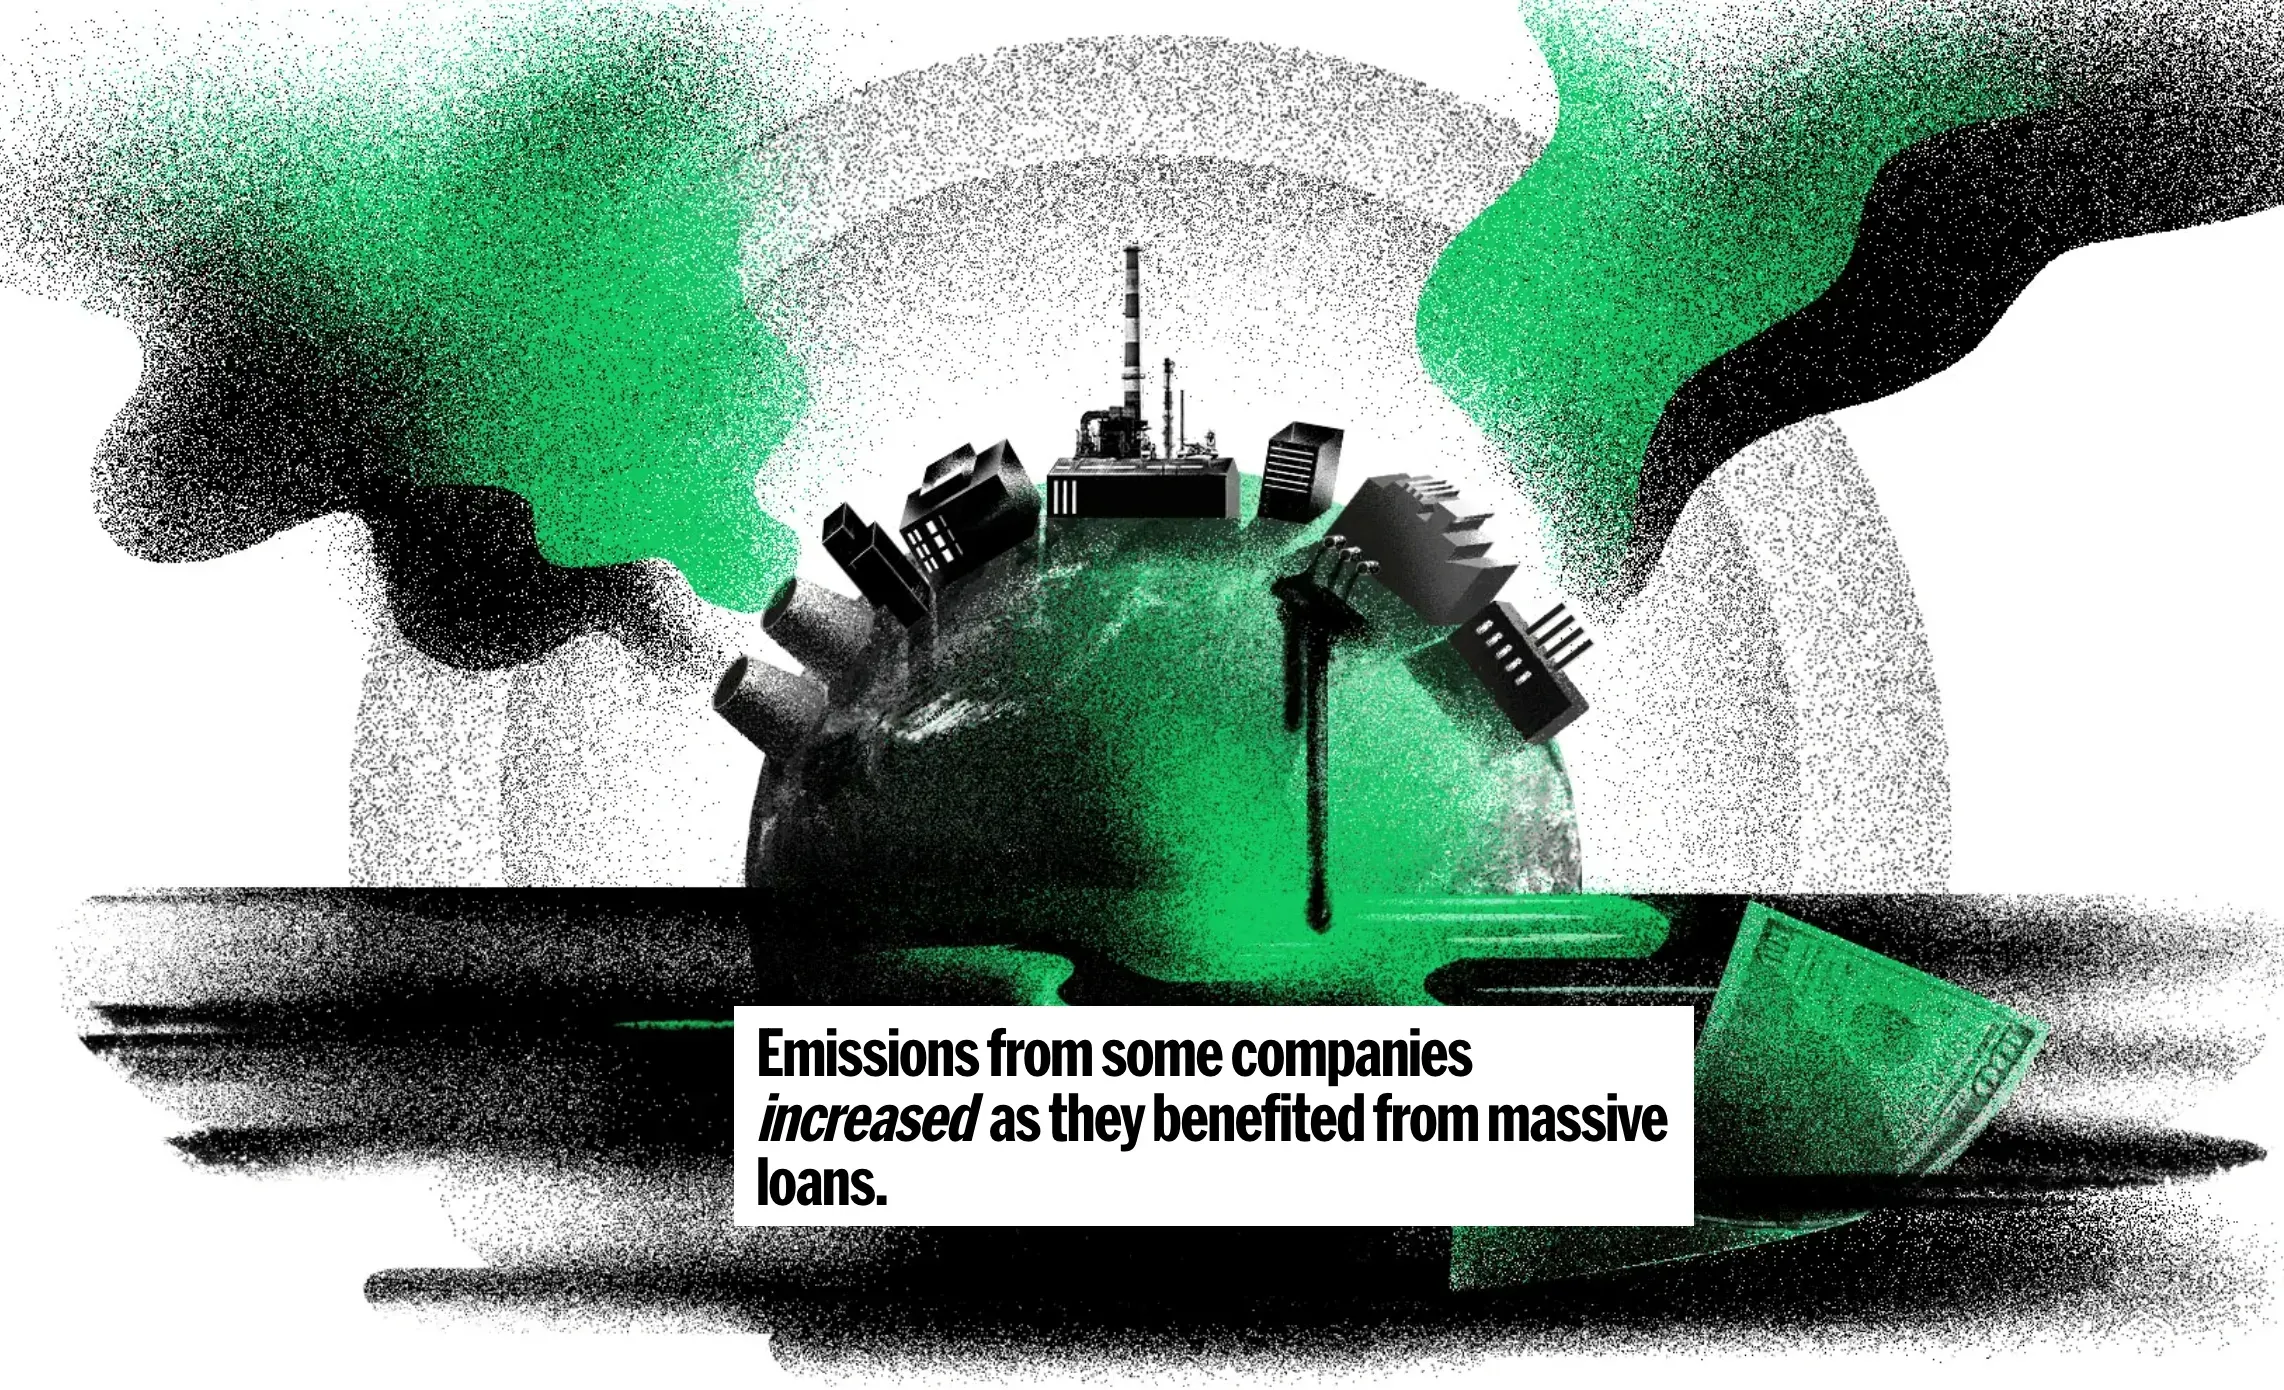
Our investigation found that nearly $300 million in sustainability-linked loans—almost one out of five dollars in total SLLs—went to companies in polluting industries such as fossil fuels and mining between 2018 and 2023. In some cases, companies’ carbon emissions increased even as they benefited from SLLs linked to decarbonization. The project was published by The Examination, Associated Press, Toronto Star, and Mississippi Today, and the reporting was supported by the Pulitzer Center’s Rainforest Investigations Network.

As a nonprofit journalism organization, we depend on your support to fund more than 170 reporting projects every year on critical global and local issues. Donate any amount today to become a Pulitzer Center Champion and receive exclusive benefits!

Hypothesis
We wondered if SLLs were being abused for greenwashing. We wanted to analyze the data and see if we could shed light on how these loans are used, and whether companies were taking better care of the environment after receiving these loans.
Data sources
- London Stock Exchange Group (LSEG)
A financial data firm with proprietary data on sustainability-linked loans worldwide, covering details such as the recipient, issue date and value of these transactions.
- Environmental Paper Network biomass data
A global dataset of companies and facilities with wood biomass operations, compiled by a network of civil society organizations.
An index of the most influential companies linked to tropical deforestation, created by the environmental transparency group Global Canopy.
- Corporate documents
Company annual reports and sustainability reports, collected from company websites.
A taxonomy of major industry groups by the U.S. Occupational Safety and Health Administration (OSHA).
Investigation methodology
1. Finding a global dataset
We wanted to get a full global picture of the market for sustainability-linked loans. Our challenge was that none of this data is public. Limited data on SLLs are available in private financial datasets like LSEG and Bloomberg, but those require expensive subscriptions.
We tried emailing LSEG to see if they would share it with us, but they wouldn’t provide more than a summary. We were able to get access by reaching out to Data Desk, a consultancy that works with journalists and other investigators of environmental finance. Data Desk has a subscription to LSEG, and we hired them to access data on SLLs from LSEG’s Deal Screener App and conduct topline analysis—a service that cost a fraction of getting an LSEG subscription.
Later in the project, we worked with the Toronto Star, which had access to a Bloomberg terminal that allowed us to confirm and dig deeper on several data points.
2. Analyzing the data
One of the biggest challenges in this project was analyzing our SLL data, which came in an Excel spreadsheet listing more than 4,500 SLL payments totaling more than $1.5 trillion. It wasn’t feasible to assess the environmental impact of each company, so we focused instead on identifying loans that went to companies in polluting industries. Prior research had examined how sustainable debt supports fossil fuels, but our analysis also brought in other key industries that are directly contributing to global warming, primarily through deforestation.
We decided on five sectors that would be at the heart of our analysis:
- Fossil fuels
- Mining
- Food and agriculture
- Timber
- Companies included in the Forest 500, an index of companies linked to tropical deforestation
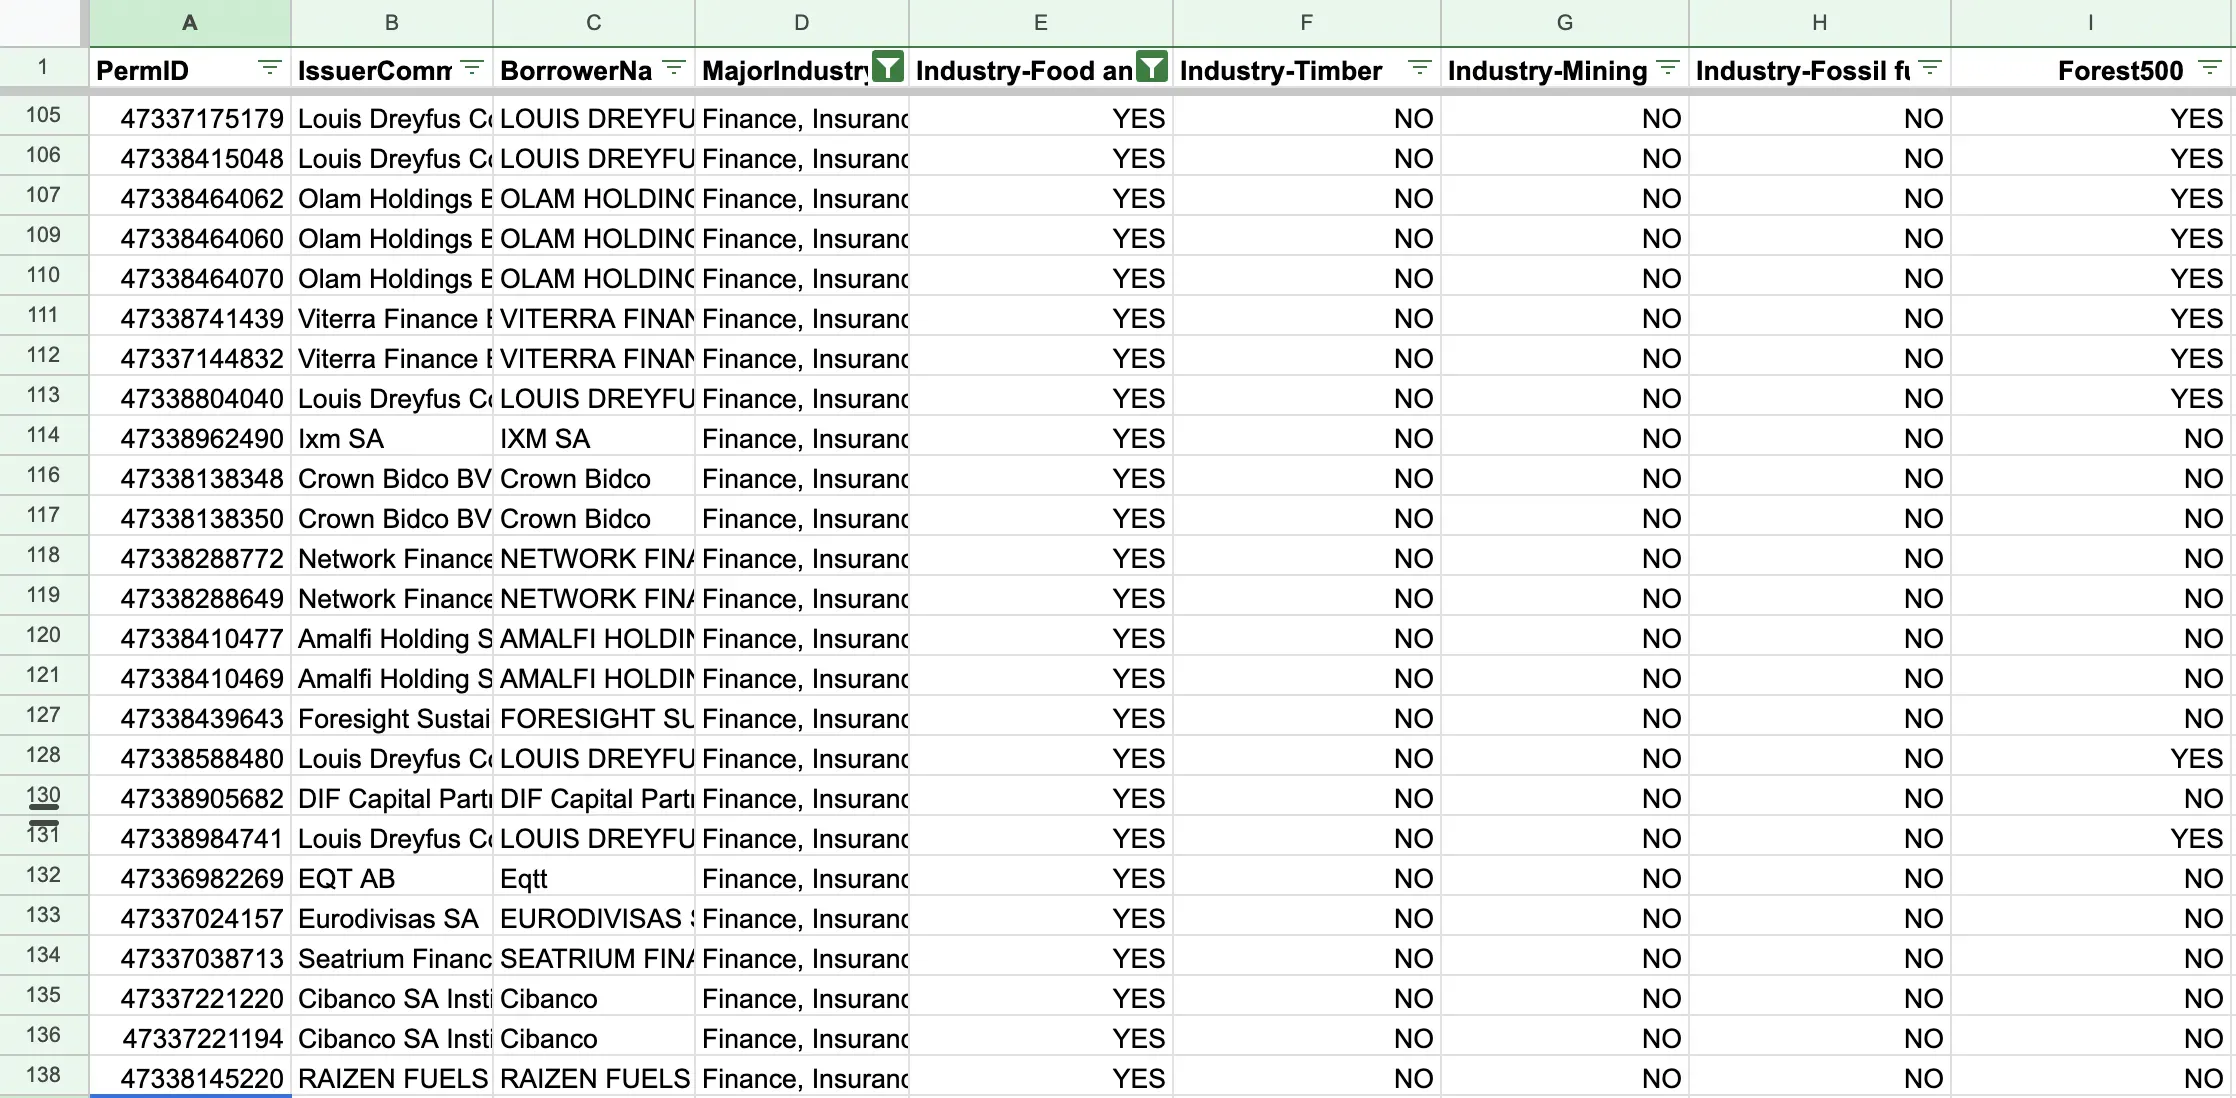
To classify companies within these industry groups, we used subcategories from the “Major Industry Group Description” variable for each company contained in the LSEG data. We then matched these subcategories with a taxonomy from the U.S. Occupational Safety and Health Administration. We included subcategories whose activities directly contribute to the main climate consequences of these broader industries, as well as subcategories that are direct buyers of climate-risk products. Industry subcategories with indirect impact on the climate were excluded. (For example, dairy farms and beef cattle feedlot companies were included, but refrigerator manufacturers that help maintain these products were not.)
Some companies were included in more than one of these categories, but duplicates were removed in calculating the total value of SLLs obtained by these industries collectively. The findings do not suggest that each individual company contributes to climate change, but they all lie within an industry that does.
3. Finding case studies
Another key challenge was picking a central case to investigate. After researching more than a dozen companies in polluting industries that we identified in our data analysis as having benefited from SLLs, we decided to focus on the UK-based energy producer Drax Group. Drax generates electricity by burning wood pellets, and presents itself as a leader in renewable energy because it is switching away from coal power. But there’s a major catch: scientific studies show that burning wood biomass is actually even worse for the climate than coal.
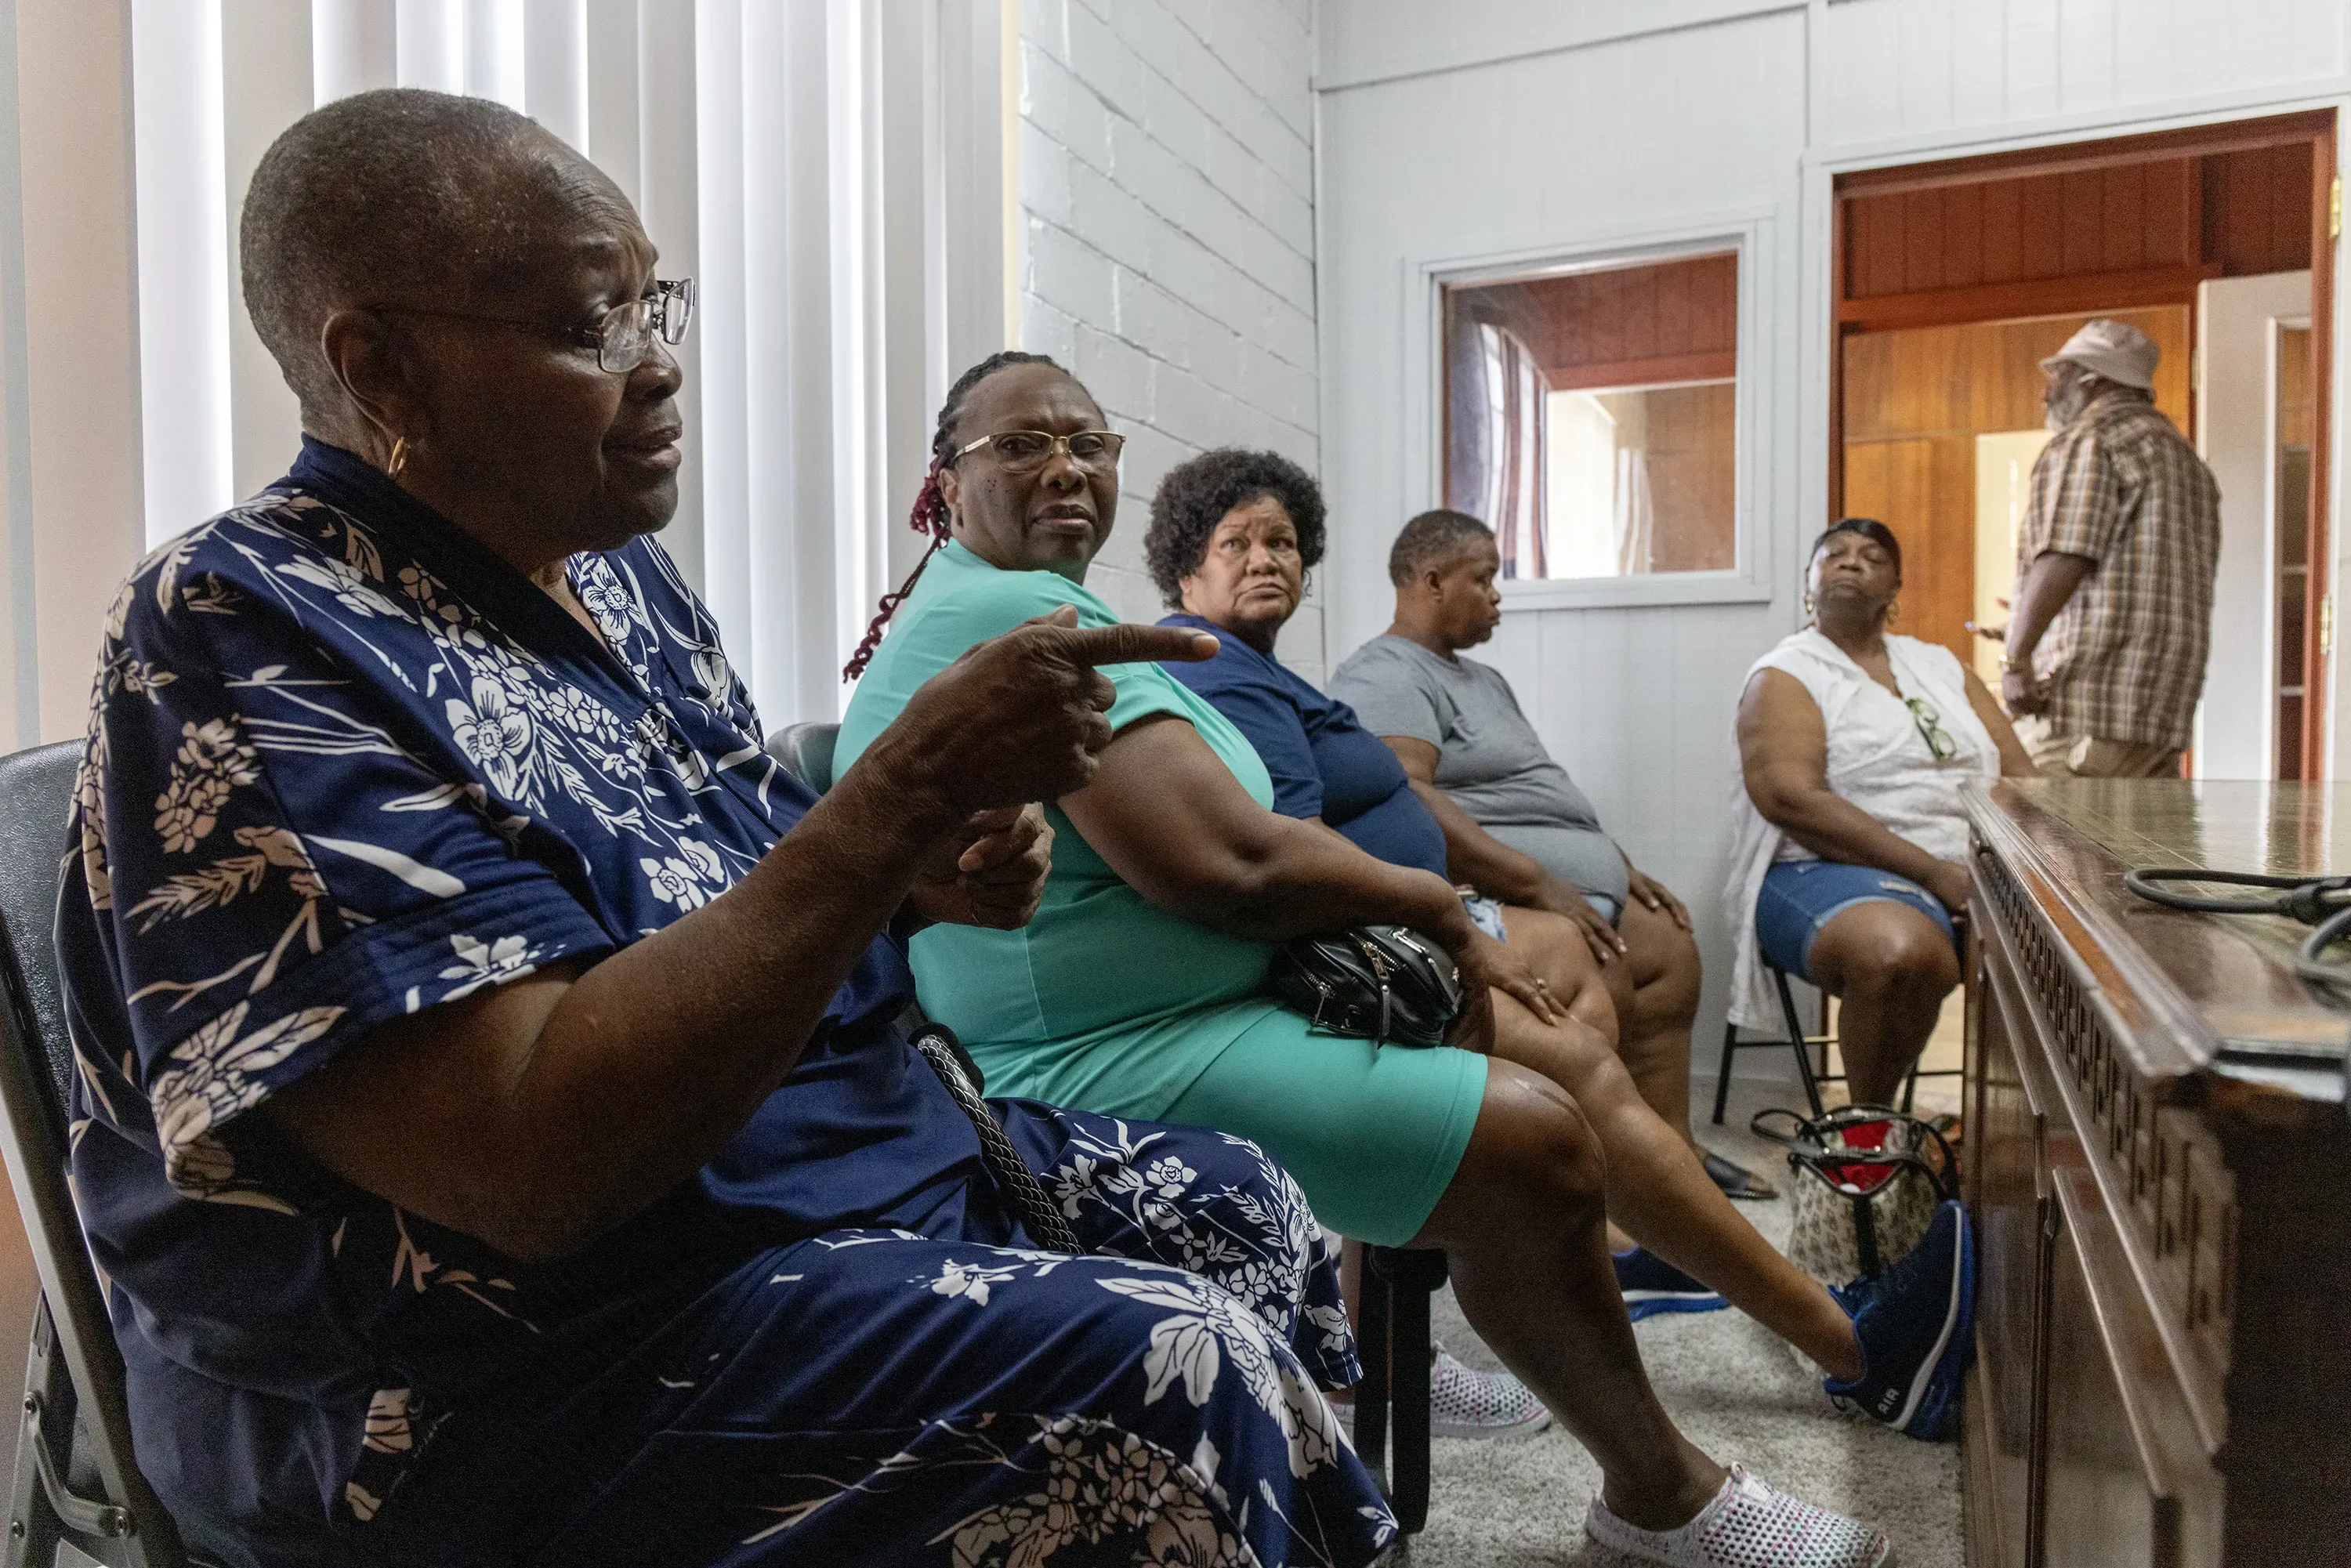
Drax’s main power plant in North Yorkshire, England uses wood pellets imported from other countries, notably the United States. Drax owns pellet plants in towns across the U.S. South, and they are disproportionately located in poor, majority Black communities. We travelled to Gloster, Mississippi, a community of fewer than 1000 people where Drax opened a plant in 2016. Mississippi regulators have imposed record fines on Drax for air pollution violations in Gloster, and a growing number of residents say they are suffering debilitating respiratory problems as a result. We spoke to more than a dozen people in Gloster about how they were affected.
4. Presenting our findings
We felt strongly about presenting our findings in a creative and engaging way. We were fascinated by the massive volumes of loans going to polluting industries, but let’s be honest - if our package was all about numbers and wonky financial products, it would put readers to sleep.
We decided to feature a creative visualization of our findings as the lede for our story. We hired a talented illustrator, Alejandra Saavedra, and commissioned five images based on a written script we had prepared. The scripts included our key data findings and you can see an example of the results here: eerie, dystopian and (in my opinion!) compelling.
In addition to our visualization and story, we decided to pierce the secrecy surrounding sustainability-linked loans by publishing our own dataset. We couldn’t publish all of the SLLs because of the terms of LSEG subscriptions, but we did publish a dataset on the SLLs that went to polluting industries. The dataset is available on The Examination’s website as a resource for anyone else who wants to investigate.
One of the key methods we used in this project was obtaining access to private financial datasets that allowed us to do an original analysis. These datasets (LSEG, Bloomberg, etc.) are too expensive for most journalists, but we can recommend a few workarounds: asking the companies for small, specific data requests, hiring consultants to get broader data access, and working with big media partners who have their own subscriptions.
Another key method was using industry group classifications contained in the SLL data to do a big picture analysis of which industries were benefiting from these loans. This can be replicated by deciding which big picture industry groups are most relevant to your reporting, and if possible, using industry categories already included in your financial dataset as the building blocks for this analysis (for example, deciding you’re interested in “Fossil Fuels” and then reviewing more specific categories like “Natural Gas Pipelines”).
In summary, we found that private financial datasets can offer insight to original investigative findings, but gaining access requires creativity and analyzing the data takes significant effort. We also found our financial data backbone needed to be combined with compelling storytelling to bring our findings to life, including strong visualizations and on the ground reporting.