COVID-19 has been a tangible international catastrophe. More than 5 million dead in two years, economic systems regularly injected with uncertainty, and a grudging acclimation to a long-term change in our habits. In Georgia, a series of Atlanta Journal-Constitution analyses have shown that COVID contributed to hundreds of millions of dollars in increased public debt costs, that Black residents and poorer residents are disproportionately harmed by the bankruptcy system, and that despite all the financial damage that has already occurred, there is a coming wave of bankruptcy filings.
We discovered this through two sources of public records—PACER, the online data service for the U.S. federal courts, and the Municipal Securities Rulemaking Board (MSRB), the U.S. regulatory body that oversees municipal securities. These services, despite containing exclusively public records, are extremely expensive. Without the $55,000 we received from the Pulitzer Center and Columbia University’s Brown Institute for Media Innovation, a media organization like the AJC would be unable to undertake an analysis to understand the finances of Georgia’s bankruptcy filers and their municipal governments.
But there’s a further barrier to the analysis, the bankruptcy records we got from PACER are the voluntary petitions filed by people seeking bankruptcy. They’re PDFs created and filed by lawyers for usage by bankruptcy courts. They’re not, yet, usable data.

As a nonprofit journalism organization, we depend on your support to fund critical stories in local U.S. newsrooms. Donate any amount today to become a Pulitzer Center Champion and receive exclusive benefits!

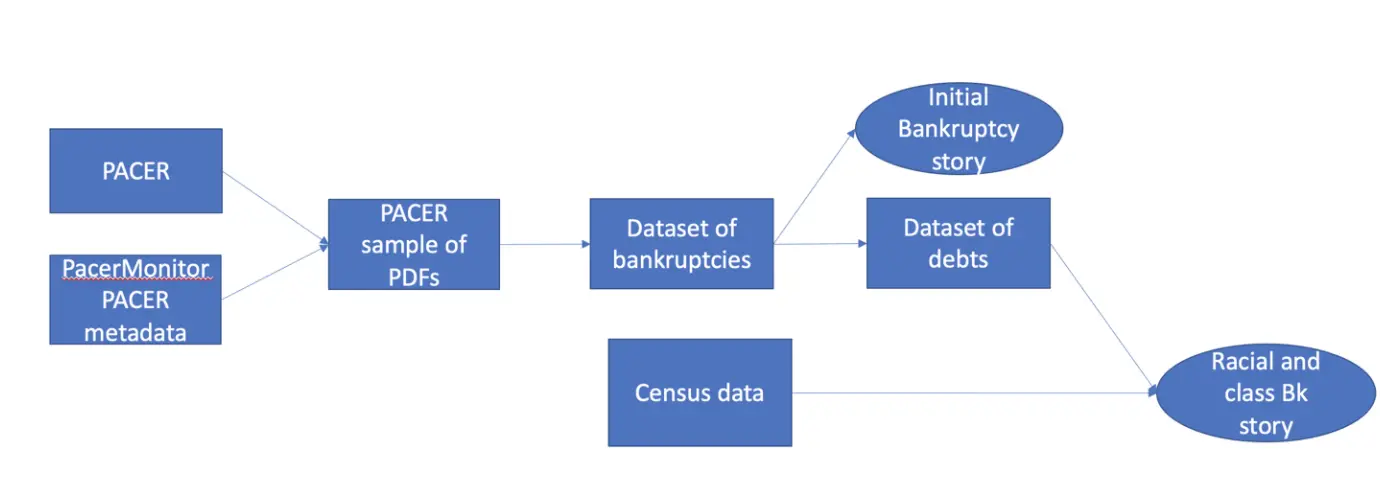
To turn them into something we can analyze and draw inferences from, we built a pipeline that collects metadata on every bankruptcy in Georgia, samples those cases, uses Amazon Textract and some local computer vision to extract data from the sampled PDFs, and produces a collection of tidy datasets containing information about each individual debtor. This pipeline took the better part of a year to build and is about 9,000 lines of R code in length.
This process is a balancing act of completeness and affordability. It costs money to access PACER cases, and while recent court decisions have declared those fees to be excessive, we had to account for them. To do this, we reached an agreement with PacerMonitor, a data collection firm that provides API access to PACER documents. This partnership allowed us to get indexing information on nearly all court cases for free, allowing us to see when cases were filed and identifying information about those cases without having to shell out money to search for them.
This proved essential because it meant we could construct a nested stratified sample of bankruptcy cases, where we collect enough bankruptcy cases over time and of different filing types from the different bankruptcy courts in Georgia to ensure acceptable error bounds on our eventual inferences.
The first step, after paying for and collecting our sample, was to upload our PDFs to an Amazon S3 bucket and use Amazon Textract (their OCR and form extraction software) to extract a first pass of the data from the bankruptcy PDFs. This worked well, around 85% accuracy hand-checked against the original PDFs, but that wasn’t enough for our purposes. Problematically, Textract returns parsed PDFs in a nested list form, which, while containing all the data, requires parsing itself.
However, because many of our local parsing decisions depended on whether certain boxes on the PDF were checked (For example: If the “I had income in 2019” box was checked, we used our “get income” subroutine.), the inconsistent checkmark types lawyers used on their PDFs and the difficulty it caused Amazon Textract led to incomplete data.
To resolve this, we built a computer vision process that automatically detected checkboxes on the PDFs and calculated the percent of filled pixels within each checkbox. If that percent reached a certain threshold, we classified the box as checked. Using Textract along with our process made our parsing pipeline more than 95% accurate.
Our cleaned data contains all the information available in bankruptcy filings for thousands of filers: the name and address of a filer, their income for the past several years and expenses, breakdowns of how they spent their money and their assets, as well as the names of their major creditors and the amounts owed.
Our bankruptcy stories are an example of how the difficulty of data journalism can come from collecting and cleaning the data. Journalists’ mandates of novelty and importance often require assembling never-before-used datasets and resolving difficult technical obstacles along the way.
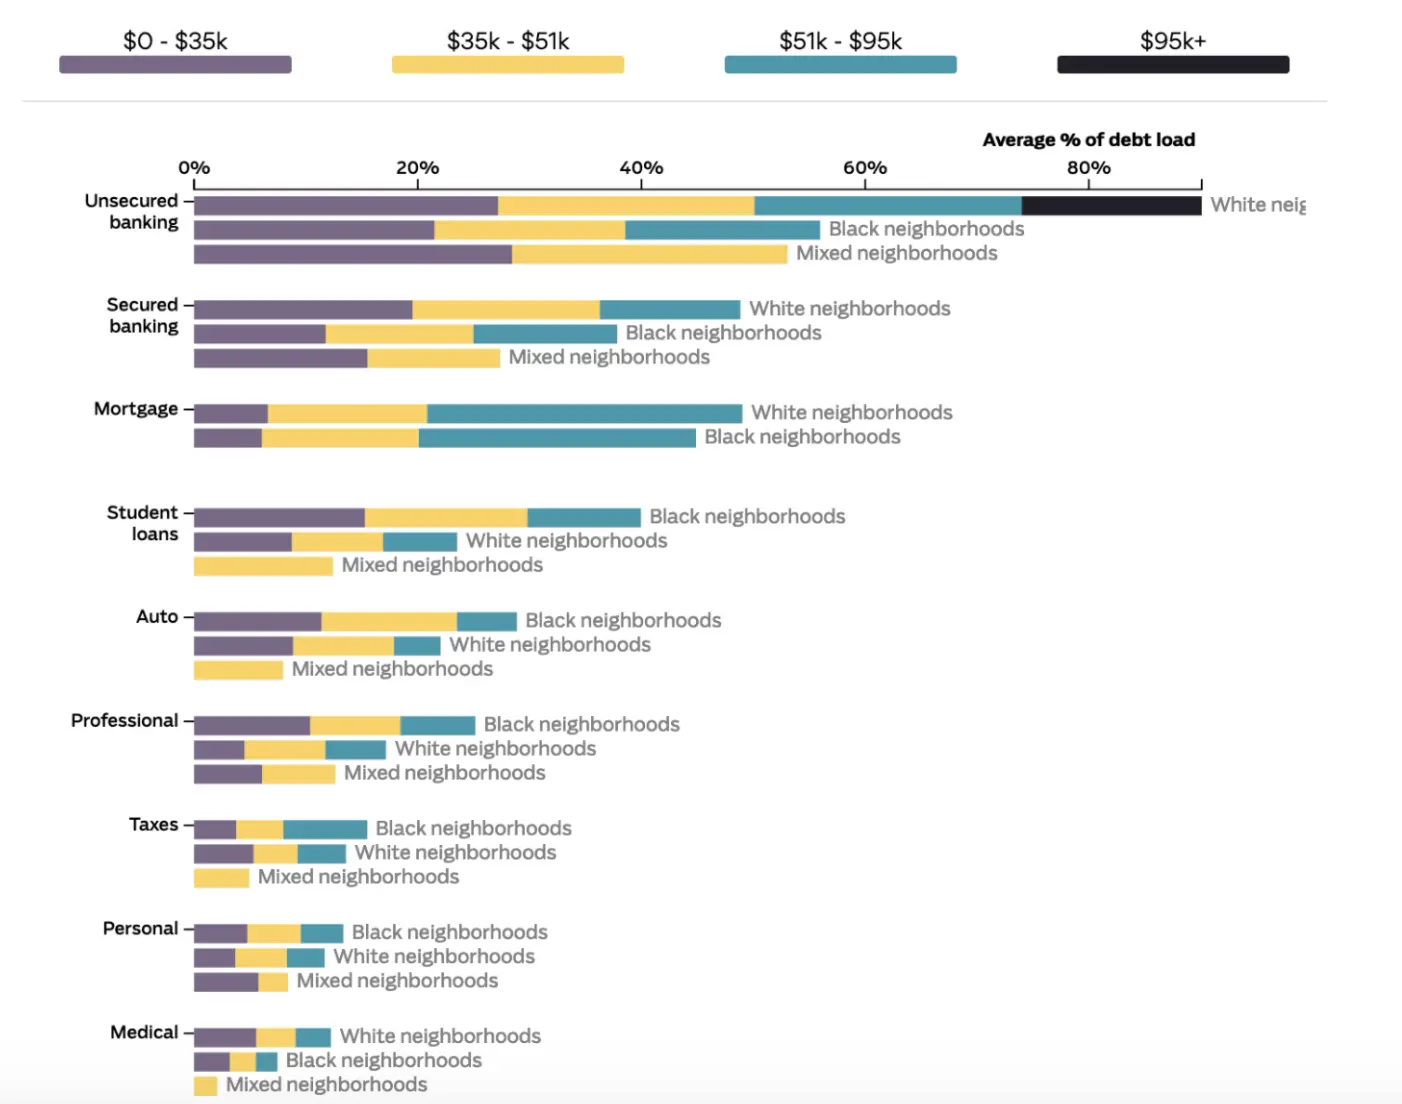
With our collected data, though, we were able to uncover discrepancies in the kinds of debts owed by white and Black filers, as well as differences between filers of different incomes, and differences in debts between race and class.

In the end, we built a scrollytelling story and an interactive that allowed readers to investigate those differences in debt along demographic lines. But data, without context, can be cherry-picked and made dangerously misleading. To avoid that, we spent months analyzing the data with rigorous statistical techniques intended to combat the multiple comparisons issues our question invited.
We wanted to know whether our three race demographic buckets (Black, white, mixed), our four income quartiles, and our 12 race and class buckets (every combination of Black, white, and mixed x income quartile) differed along any of our 26 classified debt types (student loans, auto debt, medical debt, mortgage, etc.).
But, roughly, when you’re comparing so many different things and using p-values to determine if the differences are significant, you can easily find small p-values that turn out to be spurious by chance. The multiple comparisons problem is a classical and well-studied problem in statistics showing that many simultaneous statistical tests bias your p-value estimates downwards toward significant (A semi-relevant XKCD illustrating the problem is here). Despite the understanding around the problem, data journalists often don’t consider multiple comparisons in their analysis. We used the Benjamini-Hochberg method to inflate our p-values away from 0 and get a better sense of which differences were actually statistically supported.
We also wanted to understand the degree to which being in a particular demographic group made it more likely that you’d have a particular kind of debt. (How much more student loan debt do we expect Black filers to carry relative to white filers? About 25% more, it turns out.) We built and model checked a series of Dirichlet regression and General Additive Models that allowed us to control for demographic, economic, and other variables while estimating those effects. (A technical discussion is available on our GitHub.)
Our modeling stayed behind the scenes for this story. All we presented were the final results. We didn’t spend months analyzing the data to publish our analysis; we did it so we could be confident that the simple statistics we did publish were reliable and could be explored by the public safely.
The municipal bond story we published as part of this series, on the other hand, centers the statistical modeling. This story, where we discovered that COVID-19 has led to hundreds of millions of extra dollars in interest payments for public financing projects, is directly based on inferences drawn from a series of models.
The data here is much, much cleaner. It came from the MSRB. Again, while the MSRB maintains public records, it charges tens of thousands of dollars to access the data.
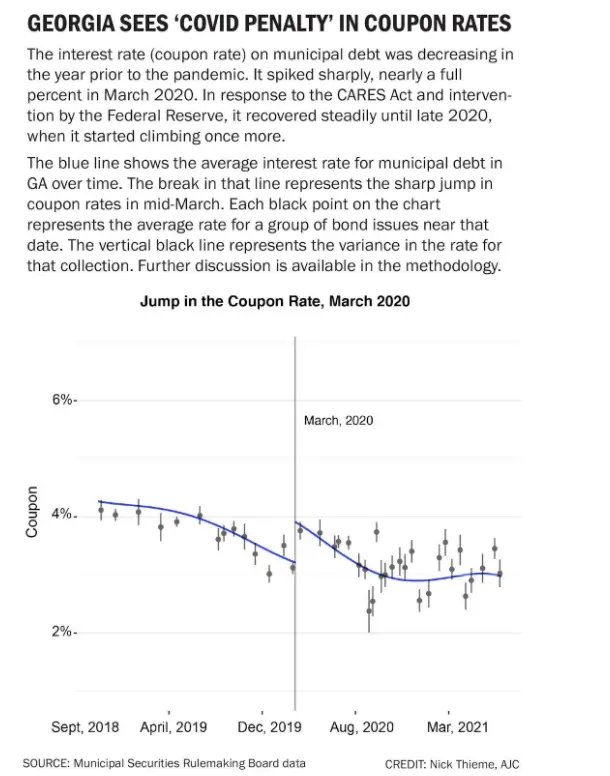
To estimate the “COVID penalty,” as we call it in the story, we fit a statistical model (a GAM) with the coupon rate (effectively, the interest rate public financing entities pay on their debt) as the dependent variable and COVID rates in the month prior to the issuance of the bond, specifics of the bond, broader economic variables, and census information as the dependent variables. The idea here is to control for as many variables relevant to the coupon rate as possible while simultaneously estimating the effect of COVID on the coupon rate. We then took the estimated coefficient for COVID and calculated the coupon rate for each bond issued post-COVID without the effect of COVID. Finally, we used that adjusted coupon rate to calculate the difference in interest payments over the remaining life of the bonds.
This is really statistical analysis as data journalism. More so than other projects, this story required a rigorous approach to statistics with a deep understanding of the model and uncertainties in the estimates. As argued by Irineo Cabreros in a 2021 Undark Magazine piece, journalists doing sophisticated analyses need to be cautious of these sorts of stories and use as many of the safeguards peer review attempts to ensure in the academic sciences.
That meant months of model checking to understand the qualities of our model residuals, sensitivity analysis to understand how the choice of a particular GAM affects the inferences, conversations with subject-matter experts, and a methodological review by Michael Lavine, professor emeritus of statistics at the University of Massachusetts Amherst. A full treatment of our model checking is available at this GitHub.
Lastly, we used a regression discontinuity design (a well-respected, post-treated method for estimating causal effects) to see whether the estimated effect of COVID was consistent with a jump in the coupon rate in early March.

It was, and we found that the coupon rate, despite responding well to congressional stimulus and Federal Reserve action, began climbing once again in fall 2020, consistent with the Federal Reserve’s research on related topics.
Our work revealed discrepancies and complexities in the financial effects of COVID on Georgians and how the bankruptcy system treats filers, but it also makes clear the difficulties in computational journalism projects. Our aim in making our work fully available online is to provide methodological guideposts and reusable code to other organizations hoping to undertake similar investigative series.


