Story
 April 10, 2023
Suspicion Machines Methodology
Country:


Every year, millions of welfare benefits recipients across Europe are profiled for fraud by opaque...

Every year, hundreds of people on welfare in a major European city find themselves under investigation because an automated system flagged them as fraud risks. What few of them realise is that they have been surveilled by an automated system that scores their lives, from their mental health history, to their relationships, to the languages they speak. They have been placed under investigation by a machine that finds vulnerability suspicious. Here's how we investigated the machine learning algorithm of a risk scoring system.
For two years, Lighthouse Reports pursued the holy trinity of algorithmic accountability: the training data, the model file and the code for a system used by a government agency to automate risk assessments for citizens seeking government services. The experiment we carried out has enabled us to publish one of the first investigations that take apart the machine learning algorithm of a risk scoring system from the inside out — rather than analysing the outputs of the algorithm and its discriminatory patterns. This level of access to what can be best understood as a suspicion machine is unprecedented and allowed us to interrogate: fundamental design choices, the entire set of input variables, and assess disparate impact.
The risk scoring system we took apart is a machine learning model deployed by Rotterdam, a major shipping hub and the Netherlands’ second largest city. Every year, Rotterdam carries out investigations on some of the city’s 30,000 welfare recipients. Since 2017, the city has used a machine learning model — built with the help of multinational Accenture — to flag welfare recipients who may be engaged in “illegal” behaviour ie. cheating the welfare system. In mid-2021, Rotterdam decided to put the risk scoring system ‘on-hold’ while working to update it.
Rotterdam’s fraud prediction system processes 315 inputs, including age, gender, language skills, neighbourhood, marital status, and a range of subjective case worker assessments, to generate a risk score between 0 and 1. Between 2017 and 2021, officials used the risk scores generated by the model to rank every benefit recipient in the city on a list, with those ranked in the top 10 percent referred for investigation. While the exact number varied from year to year, on average, the top 1,000 “riskiest” recipients were selected for investigation. The system relies on the broad legal leeway authorities in the Netherlands are granted in the name of fighting welfare fraud, including the ability to process and profile welfare recipients based on sensitive characteristics that would otherwise be protected.
While some referrals from the risk scoring system result in document checks (bank statements, proof of address), others lead to intensive investigations, including home visits where fraud investigators reportedly sift through laundry and count toothbrushes. For flagged welfare recipients, small errors have led to cuts of their benefits, large payback requests and even the termination of their benefits entirely.
In this methodology, we explain how we designed an experiment on the Rotterdam algorithmic risk scoring system to demonstrate how it systematically generates suspicion of vulnerable groups.
Rotterdam’s risk scoring system is just one of many similar systems utilising machine learning that have been deployed by governments across the world. These systems automatically assess and assign risk beyond the scrutiny of citizens, civil society or even, in some cases, the agencies who deploy, but do not necessarily understand, the technology.
For our analysis, we obtained unprecedented access to Rotterdam’s risk scoring system. After both formal and informal public records requests and months of negotiations, we received the machine learning model used to score recipients, the source code used to build it and the data used to train it. Rotterdam was the only city, among dozens contacted, to grant us this level of access. It meant we could trace exactly what personal data the agency decided to feed into the machine and how the machine processed that data to make decisions about who is suspicious and who is not.
The findings are stark. The suspicion machine passes harsher judgement on: parents, young people, women, people with roommates, people who do not have enough money and people with substance abuse issues. Some of the variables that increase a person’s risk score are totally beyond their control: their age and gender for example. Others are fundamental to why people need social welfare in the first place: they face financial problems, they struggle with drug addiction, they cannot afford the rent to live independently. And most problematically, some seem to ethnically profile people based on the languages they speak or their ability to speak Dutch, which is widely considered a proxy for ethnicity.
Ground reporting in Rotterdam, including more than a dozen interviews with people who had experienced fraud investigations, informed our selection of archetypes — (combinations of variables) that we then tested. This includes the archetype of a mother struggling financially, one of the most high risk profiles. In addition, from the over a dozen input variables measuring residency, we developed the archetype of a migrant man from an ethnically mixed neighbourhood where people tend to live in crowded housing. Despite the purported nuance of the machine learning model, both archetypes scored higher as we fed in these traits, and even more so when we made them young and with poor Dutch language skills.
The unique level of access we obtained allowed us to test how and why individuals with certain characteristics receive higher risk scores. Nonetheless our approach has limitations:
- While we did gain access to internal performance reports, which show the system’s lack of accuracy overall, we do not have data showing accuracy across different subgroups. In other words, we could test whether women receive higher risk scores than men, but we could not compare this to whether women or men were actually found to commit fraud at higher rates.
- We were only able to run our experiment on the data that the machine learning model was trained on, which is unrepresentative of the wider benefit recipient population in Rotterdam.
Human rights groups have voiced their concern over the fundamental due process violations embedded in predictive analytics: as with the Rotterdam model, it is no longer necessary to engage in any kind of suspicious activity to attract scrutiny from law enforcement nor can somebody who has been targeted appeal for a meaningful explanation. Exploiting vulnerabilities in this way, organisations like Amnesty have argued, is the digital equivalent of racial profiling and stop and frisk.
What We Have and How We Got It
Interrogating government use of automated decision-making is a challenge for journalists and other watchdogs. Independent audits and peer-reviewed evaluations are rare, both because the code is often proprietary and because of data privacy concerns, especially in the European Union. Public agencies and companies can also be reluctant to commission (public-facing) audits for fear of reputational damage in case the findings are negative.
It took nearly two years to acquire the materials necessary to carry out this experiment. We sent FOIAs (Freedom of Information Act requests) to governments across Europe requesting documentation, evaluations, code, and training data for machine learning models similar to the one deployed by Rotterdam. Ultimately, in Autumn 2022, Rotterdam agreed to hand over the model and other technical documentation. To date, no other agency has been as forthcoming.
In response to our initial FOIA, we received the source code used to train the model, the list of variables and their relative importance, evaluations of the model’s performance and Rotterdam’s handbook for data scientists. Over the course of a year, we received further material, including documents that describe the variables used by the model and, eventually, the trained machine learning model file itself.
What Rotterdam did refuse to disclose — citing data privacy concerns — was the training data. Instead, they sent us a series of histograms representing the distribution of each variable in the training data in an HTML file.
When we inspected the code of the HTML file, we found that Rotterdam had accidentally disclosed real disaggregated training data in the parts of the source code that power the histograms. Rotterdam later confirmed that this was the case, saying that "this should not have happened" and that the disclosure was reported to the city’s privacy officer.
While the dataset contained real rows of data, personally identifying information such as names, phone numbers, or postcodes were not disclosed.
We immediately moved the training data and histograms to a secure location and implemented a strict access policy. After internal deliberation and consulting privacy experts and media freedom lawyers, we ultimately decided that we would keep the training data for our analysis and delete it after publication. European data protection law contains specific exemptions for journalistic work. Fundamentally, we believe that using the pseudo-anonymized data in order to analyse the Rotterdam risk scoring system, which has selected thousands of people for fraud investigations, is firmly in the public interest.
While ultimately it took months of at times contentious negotiations, the city did disclose the machine learning model file, a landmark decision within this space that deserves recognition.
In a response to our investigation, Annemarie de Rotte, the city’s director of income, said: "The Municipality of Rotterdam considers it very important that not only we ourselves, but also other governments and organisations are aware of the risks of using algorithms, such as in the risk assessment model you have investigated. Nevertheless, we have decided to give you maximum insight into the model used by us in 2020. We have done this not only because of our desire to be an open and transparent organisation, but also to be able to learn from the insights of others, such as Lighthouse Reports.”
The Model
In order to learn which variables are predictive of increased fraud risk, Rotterdam uses supervised machine learning to comb through a vast trove of data it collects from benefits recipients. This requires building a labelled training dataset, which in the case of Rotterdam is composed of individuals who have previously been investigated with the label ‘yes fraud’ or ‘no fraud.’ The model’s goal is to learn what patterns distinguish those labelled ‘yes fraud’ and ‘no fraud’.
The specific algorithm used by Rotterdam is called a ‘Gradient Boosting Machine’. Its building blocks are decision trees. In a decision tree, the path each individual (represented as a row of data) takes is determined by a number of questions. Each question relates to one of the person’s characteristics, for instance “Is your gender female?” The answer to the question determines whether the person continues on the left or right branch of the tree and which questions they are subsequently asked. Eventually, the person reaches a “leaf” that assigns them a value. In the model, each decision tree consists of up to nine ‘questions.’
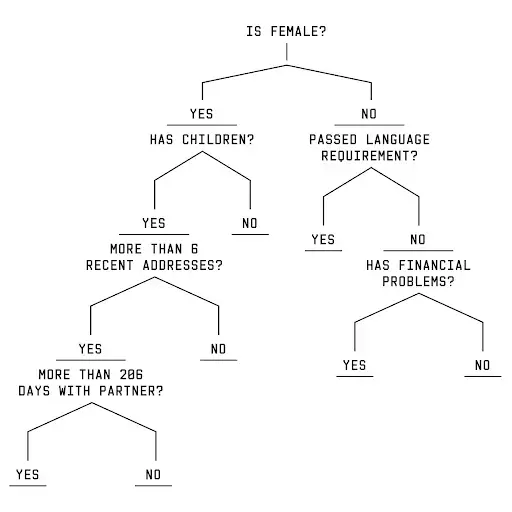
Gradient boosting machines take these decision trees and stack them on top of one another (500 trees in Rotterdam’s case), each tree seeking to correct for the mistakes the previous tree has made. The values assigned to each person at the leaves of the trees are then aggregated and scaled to generate the risk score.
Input Variables
Rotterdam builds this gradient boosting machine using 315 variables contained in the training data. In addition to dozens of variables measuring the type of appointments and other interactions between beneficiaries and the welfare system, Rotterdam used subjective case worker assessments — including comments on physical appearance — to predict whether individuals would commit fraud.
The model’s language variables are of key interest because they are the strongest proxy for ethnicity we could identify. In a report titled ‘Discrimination Through Risk Profiles,’ the Netherlands Institute of Human Rights — an independent body that advises the government — found that selecting people as high risk on the basis of language “constitutes indirect discrimination on the basis of origin (and thus race).” Furthermore, in its analysis of the variables used by the Rotterdam algorithm, the Dutch Court of Audit pointed to “fluency in the Dutch language” as an example of a variable that could “result in unwanted discrimination.”
Model Performance
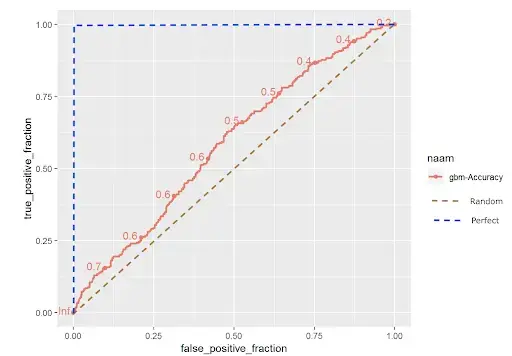
Internal documents show that when Rotterdam evaluated its model, they found that it is only 50 percent more accurate at predicting fraud than selecting people at random.
The city also shared the model’s ROC curve, a common performance evaluation metric in machine learning. The ROC curve looks at the tradeoff between the share of individuals correctly predicted as high risk amongst those labelled high risk (TP/(TP+FN)) and the share of individuals wrongly predicted as high risk amongst those labelled low risk (FP/(FP+TN)). Looking at the graph below, the model only marginally improves on the diagonal line indicating random selection. When we asked expert reviewers to interpret the model's ROC curve, AI-ethicist Dr. Margaret Mitchell told us that the ROC indicates the model is “essentially random guessing.” She added that it clearly failed to meet performance standards necessary to responsibly deploy it in the real world.
Fairness: Technical Definitions
Rotterdam was clearly concerned about the disparate impact its model might have on marginalised groups. In fact, Rotterdam’s code includes a script that evaluates the model for disparate impact. Specifically, the code tests whether people of a specific gender, age, district, or relationship status are over-represented in the high risk group. While Rotterdam has implemented these checks to evaluate the model’s disparate impact, an internal handbook makes no mention of the script and Rotterdam confirmed that it was not used.
Rotterdam said that the model’s use was suspended after similar internal assessments uncovered bias, which they were unable to eliminate. Many other algorithms have been plagued by similar problems. Where independent research has been carried out, investigations have repeatedly found evidence of disparate impact, where certain demographic groups were targeted at higher levels than others.
Within journalism, the flagship investigation tackling racial bias in algorithms is ‘Machine Bias’ by ProPublica. In it, journalists analysed an algorithmic scoring system named COMPAS, developed by the US company Northpointe, that was used to predict the likelihood of re-offending. ProPublica found stark racial discrepancies in the errors the system made: Black defendants were almost twice as likely to be wrongly labelled high risk than white defendants (labelled high risk by the scoring system, but did not reoffend), while white defendants were almost twice as likely to be wrongly labelled low risk (labelled low risk by the scoring system, but did reoffend).
For our experiment, we were interested in whether welfare recipients with certain characteristics are flagged for investigations at higher rates than others. We carried out such tests for all 315 variables in the dataset, but we were especially interested in testing variables related to characteristics falling under two categories.
- Groups protected by the Netherlands’ General Equal Treatment Act, which prohibits direct and indirect discrimination based on race, gender, nationality, sexual orientation, or marital status.
- Variables relevant to ongoing debates in the Netherlands about the welfare system and algorithmic risk profiling. In 2019, a decade-defining scandal known as the toeslagenaffaire (child benefits scandal) saw revelations of a damaging campaign against parents receiving welfare benefits. While the extent of its role remains unclear, one of the methods with which parents were selected for investigations was a machine learning model abandoned after the scandal came to light. Both the Dutch Data Protection Authority and the Dutch media have criticised the model for using variables like income and whether a benefit recipient was a Dutch national.
To develop our experiment, we dived into the dozens of distinct mathematical definitions of fairness developed by academics after ProPublica’s published Machine Bias. For our own experiment, we focused on two of them known as statistical parity and controlled statistical parity (also known as conditional statistical parity). Both of these definitions are mathematical tests of disparate impact: are groups disproportionately rated high-risk by the algorithm? We focused on these definitions because they are the most ambitious definitions that we could pursue with the data we have. Many of the alternative definitions of fairness require additional data access, such as whether the people predicted high risk for fraud actually went on to commit it — which was denied to us in this instance on the grounds of privacy.
Intuitively, statistical parity is satisfied when two groups (for instance, men and women) have an equal probability of being labelled as high risk. Formally, statistical parity is defined as:
P(d = 1|G = 1) = P(d = 1|G = 0)
where d represents the classification as high risk (d = 1) or low risk (d = 0) and G describes group membership, for instance gender.
Rotterdam's own code includes tests similar to statistical parity. Their code tests whether certain groups are over-represented in the highest risk decile, i.e., amongst the top 10 percent highest risk scores, which we adapt as the high risk threshold for our tests as well. Two groups would be equally represented if the following condition is met:
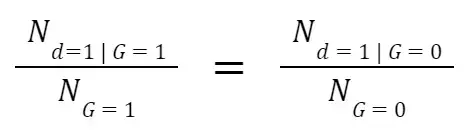
This definition compares the proportion of people who receive a high risk score across different groups. The numerator is the number of individuals labelled high risk for a given group, and the denominator is the total number of individuals belonging to this group. In its code, Rotterdam considers all individuals with the 10% highest risk scores as high risk. We adopted this threshold. This means that if more than 10 percent of individuals belonging to a group are classified as high risk, then the group is over-represented. Similarly, if less than 10 percent of individuals are classified as high risk, then the group is under-represented in the high risk group. We use these measures of over- and under-representation to discuss whether groups are flagged by the model at disproportionate rates.
We decided to test controlled statistical parity in addition to ‘simple’ statistical parity because we wanted to know if the model treated group members differently because of group membership itself or other variables that might be correlated with group membership. Controlled statistical parity is a more refined version of simple statistical parity in that it is only violated if two groups receive different risk scores, conditional on their other characteristics being the same. For instance, when assessing whether controlled statistical parity is violated for different genders, we want to make sure that the men and women (the Rotterdam model only uses two genders) are of equal age, live in the same districts, etc. This allows us to determine whether group membership itself causes the model to change individuals’ scores. Controlled statistical parity is satisfied when:
P(d = 1 | G = 1, C = c) = P(d = 1 | G = 0, C = c)
The variables in this definition are the same as above, with the addition of C, representing characteristics that are the same between groups 0 and 1.
‘Simple’ and controlled statistical parity have different implications. As explained above, simple statistical parity may be violated not because of group membership itself but because group membership is correlated with other variables that drive up the score. For instance, we may observe that women receive higher risk scores than men. But this difference in risk scores could be because being a woman is correlated with younger age or other characteristics that increase individuals’ risk scores, rather than gender itself. If such differences are due to the training data (e.g., Rotterdam only included young women), then looking at controlled statistical parity is more informative because it controls for other characteristics.
Fairness: Experimental Design
For each of the 315 variables that the risk scoring system accounts for, we tested conditional and statistical parity by generating custom datasets and feeding them into Rotterdam’s risk prediction model.
For simple statistical parity, we took the real training data and compared the risk scores between people with or without a certain characteristic, such as men and women. This tells us how high men and women actually score, but it does not tell us if those differences in scores are directly influenced by their gender.
For controlled statistical parity, we again started with the real training dataset but this time we made two copies of it. Sticking with the gender example, we made everyone in the first copy of the dataset a man and everyone in the second copy a woman. We then scored each row in both copies and compared the scores. In other words, we take each individual in the dataset and calculate their score two times, one time with their gender set to man and one time with their gender set to woman.
With this approach we could check for each individual whether their gender actually resulted in a higher score. To make sure that our results are not biassed by the fact that we evaluated the model with the very same data with which it was trained, we generated a synthetic dataset, designed to look like the training data. We ran all of our tests on both the training and the synthetic data, but as long as results do not diverge, we focus on results from the training data.
For a more detailed explanation of how we prepared the data for our experiment and how we generated the synthetic data, see Appendix II.
After generating the datasets for each experiment, we fed them to the machine learning model, a file that can be run from the R programming language. The final model takes as input a dataset where each row is an individual and each column is a variable. For each row in the dataset, the model outputs the probability that this individual has committed/is committing fraud. This probability, or risk score, becomes the basis for the subsequent analysis.
Similar to Rotterdam in its own evaluation procedure, we use the highest risk decile, as the threshold for high risk. We calculated the threshold on the basis of the training data, which tends to have higher risk scores than the real Rotterdam welfare population. To make sure that our results did not depend on the threshold itself, we looked at various other thresholds, all of which gave us substantively similar results.
With the threshold value in hand, we looked at the share of different groups who are above this ‘high-risk threshold.’ We also looked at the distribution and averages of risk scores across groups and tested the statistical significance of these differences by running paired Student T-Tests.
It is impossible to dive into the results for every single variable in this document — although you can find those on Github. Instead, here we are focussing on variables covered in the ethical baselines discussed in our Technical Definitions section. We also combined multiple variables into ‘archetypes’ to explore how people’s vulnerabilities can interact with one another to increase individuals’ risk scores. For a more detailed discussion of how we created our archetypes, please see Appendix III.
Fairness: Single Variable Findings
Language Findings
Language variables, which can be proxies for ethnicity and race, make up a significant chunk of the total variables. Around 20 variables measure various facets of language, including spoken language, Dutch language skills, and the Dutch language requirement. In the Netherlands, benefits recipients are required to obtain a certain proficiency in Dutch or risk having their benefits reduced or terminated altogether. Recipients who have had eight years of Dutch-language education automatically pass the language requirement.
Dutch language proficiency is not a perfect proxy for ethnic background. There is a significant number of people who have migrated to the Netherlands from places like the US who also do not speak Dutch. Yet data from Statistics Netherlands suggests that these are for the most part not the people receiving municipal welfare benefits. Nationally, people of a non-Western migration background represent 51 percent of people who receive municipal benefits, while people of a Western migration background make up only 9 percent. We asked the city of Rotterdam for this same breakdown for people who receive municipal benefits in Rotterdam, but they refused to disclose them.
The cumulative effect of the variables measuring Dutch proficiency is substantial. If we make a copy of the dataset where everyone has poor Dutch proficiency and a copy where everyone has strong Dutch proficiency, we see those struggling with Dutch are nearly 2.22 times more likely to be flagged than those who are proficient in Dutch. In the synthetic data the difference between the penalty for struggling with Dutch is even greater.
The variable that had the largest impact across both experiments was passing the Dutch language requirement. People who had not passed their language requirement are almost twice as likely to be flagged when compared to those who have passed the test. Meanwhile, in our controlled statistical parity experiment, people who haven’t passed their requirement are more than 1.5 times more likely to be flagged than people who have passed their requirement 720 days ago.
Passing the Dutch fluency requirement is not the only language variable that can boost a non-native Dutch speaker’s risk score. One of the language variables stores the language they speak, with numerical codes for 265 unique languages. Nonetheless, many recipients are coded as ‘0,’ which Rotterdam admitted they did not understand. We see recipients who are coded ‘0’ are overrepresented in the high risk group. Meanwhile, recipients who speak Dutch or Turkish are underrepresented in the high risk group.
Lastly, recipients who speak a language besides Dutch are over-represented in the high risk group by a factor of 1.4, while people who only speak Dutch are overrepresented in the lowest risk group by a factor of 1.3.
Age
According to Rotterdam’s internal evaluations, the risk scoring system relies on a recipients’ age as by far the most important characteristic for determining the risk score. The impact of age is nearly three times that of the second most important variable . In our tests, we found that, when compared to gender and parenthood, age has much stronger effects, even when isolated. Age, by itself, can move average risk scores by 0.109: all the way from 0.45 to 0.559.
Looking at the risk scores, the results show a strong bias against the young. For age, we looked at values at 10-year intervals. Across both simple and statistical parity the older someone is the lower their risk score.
Parenthood
When we looked at parents, we found that they were almost 1.7 times more likely to be over the high risk threshold compared to their proportion in the training data. Across all deciles, as the risk score increases, so does the share of parents.
To figure out whether having children in itself causes people’s risk scores to increase — or other variables associated with parenthood — we ran the conditional parity experiment. We created and scored two copies of the training dataset, one where everyone is made to be a parent and one where everyone is made to not be a parent. When we did this, we saw that parents with one child are over-represented in the high risk group by a factor of 1.09.
If we look at both experiments, we can conclude that parenthood itself explains some of the over-representation in the high risk group, but also that other variables associated with parenthood (like having been in a relationship) increase people’s likelihood of ending up in the high risk group.
Gender
We found there is a small — yet statistically significant — difference between the risk scores of men and women. In our simple statistical parity experiment, women are overrepresented in the high risk group. Similarly, in our controlled statistical parity experiment, we saw that men were underrepresented. Men were underrepresented by a factor of 0.90 while women were overrepresented by a factor of 1.13. Women are therefore 1.25 times more likely to be flagged than men.
When we looked at average scores across simple and controlled statistical parity, we found an interesting pattern. Women on average have risk scores that are 0.01 higher than men’s. However, when we only vary gender (ie. isolate the effect of gender) in our controlled statistical parity experiment, this difference actually grows to almost 0.02. In other words, we have the opposite effect seen in our parenthood experiment. Being female in isolation increases risk scores, but that effect is counteracted by other variables correlated with gender that end up increasing men’s risk scores or decreasing women’s risk scores. For instance, it could be the case that women tend to have better Dutch skills which improves their risk scores relative to men.
This effect is even more apparent when using synthetic data: In the simple statistical parity experiment, men are slightly more likely to be flagged than women. But controlling for everything else, i.e, testing for controlled statistical parity, gender clearly increases risk scores.
Financial Struggles
Recipients who are struggling financially receive higher risk scores. In our simple statistical parity experiment, they were overrepresented by a factor of 1.7 in the high risk group. That means that people who have been struggling financially are more than twice as likely to end up in the high risk group than people who are not.
Archetypes Key Findings
The promise that machine learning models such as the Rotterdam welfare risk scoring system make is to identify hidden patterns, combinations of characteristics, that make people likely to commit fraud. Since it is not possible to test every single possible combination of the 315 variables, we constructed profiles of welfare recipients who already have some of the characteristics that we know the risk scoring system assigns a high risk score to based on the single variable findings.
We found that when we put together profiles of people using what we learned from the single variable results and the welfare recipients we met, the patterns that emerge speak to vulnerable people struggling on a number of fronts. For a more detailed explanation of how we created our archetypes, see Appendix II.
Financially Struggling Single Mother
Our first welfare recipient was constructed by taking all of the people in our training data and setting a few key characteristics. We made her a woman, a mother of two children, who had been in a long term relationship, and has been struggling financially. Since the model processes changes in characteristics different for each person, we wanted to know how each characteristic would impact her score compared to all the other possible permutations.
First, we wanted to understand the impact of being both a woman and a parent. We know that independently, both women and parents scored higher. To illustrate what we did, let’s begin with a simple test and calculate the average score of all the combinations between gender and parenthood.
We can see in the table above the ‘gender penalty’ is 0.018 for women with children and 0.022 for women with no children.
We can also identify the most ‘high risk’ profile out of the above combinations, namely, women with children.
We then looked at how economic and relationship status impacted our mother’s score. There is a variable that measures how many days the recipient has had financial problems. The risk score algorithm also ingests a variable about whether you are single or not, but it has little impact on the score. The variable that does make a difference is the number of days in the recipients' current or previous relationship. We tried several combinations to see how our mother’s score would change.
The table below lists the three combinations with the highest average risk scores and the three combinations with the lowest risk scores.
Looking at the above combinations, we can see that the highest risk person would be a woman who (1) has children (2) has been in her (last or current) relationship for 2 years and (3) has struggled with financial difficulties for 500 days. Our hypothetical struggling single mother fits into this category.
Overall, mothers with financial difficulties are almost three times more likely to be flagged than the lowest-risk archetype: men with the opposite characteristics.
There are of course other characteristics that could also drive up the score of our archetype. If we made her a 28-year-old mother, more than 28 percent of the dataset would fall above the training data’s high risk threshold.
Migrant Worker
A major criticism of algorithms is their disproportionate impact on ethnic minorities. We created the profile of a young migrant worker to understand how characteristics that may be common to migrants in Rotterdam impact risk score. We chose an Arabic-speaking man who lives in a predominantly migrant neighbourhood in a shared living space. Using the exact same methodology as for our financially struggling mother, we tried different combinations of variables that may apply to someone who recently migrated to the Netherlands and is still learning to speak Dutch.
We began by examining limited combinations of address-related variables. From running those combinations, we established the following high risk and low risk profiles.
*According to statistics from Rotterdam, nearly 70 percent of residents of the Delfshaven district are of migrant background.
Already, we see that the higher risk profiles align with our migrant male who lives in shared housing, while a low risk person is the opposite: he lives alone in a non predominantly migrant neighbourhood. We then added variables related to Dutch proficiency, while keeping the above high risk combination (living in Delfshaven with 3 roommates) fixed.
Next we were interested in how a lack of Dutch skills would affect the migrant worker profile. As part of our investigation, we ran a correlation analysis on all the model’s input variables to see which tended to move together. When we did this, we noticed a correlation between language skills and case worker estimates of how long a benefit recipient would need to find a job. Those who did not pass their language requirement were often assessed as unlikely to find a job quickly.
For calculating these averages, the district has been set to Delfshaven and roommates has been set to 3.
It should be noted, however, that there are a number of other variables — mostly relating to contact or meeting with the municipality — that also measure a successful completion of the language requirement. The cumulative effect of these variables for our archetype is that 15.44 percent end up above the high-risk threshold.
Our correlation analysis also demonstrated that people with low language skills were less likely to receive comments in fields like ‘attitude.’ In the case of our archetype, this led to a small yet tangible increase to their score.
With this constellation of features, the average score of our archetype is 0.544. Also like our financially struggling mother, more than 16 percent of the dataset becomes high risk if everyone is given the above variable values.
Intersection of Our Archetypes
The archetypes above already reveal how a small number of characteristics — mostly out of people’s control — can dramatically raise a welfare recipient’s score. In reality, most people’s lives are lived across a much broader cross section of variables. We therefore wanted to look at the intersection of both of our archetypes: a migrant mother. We constructed two copies of the training data, one where everyone was a migrant mother, and one where everyone was a single Dutch man.
The migrant mother archetype above is more than five times as likely to be flagged for investigation as the archetype with the opposite characteristics. More than 26 percent of people in the training data where everyone is a migrant mother is above the high risk threshold. If we use the approximated real world risk threshold, which is lower than the training data threshold, nearly 50 percent of the dataset is high risk.
Limitations
Statistical parity reflects a commonsense understanding of fairness – one group shouldn’t receive higher scores than others – but it has an important shortcoming: statistical parity does not address the baseline prevalence of fraud in groups (e.g. if younger people do commit more fraud than old people). The model is designed to find groups at a higher risk of committing fraud and to select them for investigation, so we would expect some groups to get higher scores than others.
If we had gotten access to the labels (‘yes fraud’ - ‘no fraud’) for the training data, we would have been able to investigate whether the model performs equally well across groups (e.g., men and women). For instance, we would have been interested in seeing whether men and women with a given risk score commit fraud at equal rates and whether error rates (predicted high risk even though the individual is labeled ‘no fraud’ or predicted low risk even though the individual is labeled ‘yes fraud’) across both groups are even. Such tests would have been most relevant if they were conducted on a randomly selected sample of welfare recipients. Unfortunately, we were not given the training data labels, nor do we know which of the individuals in the training data were randomly selected for investigation.
However, even if differences in risk scores between different groups reflect ‘real world’ trends, these trends themselves need to be critically investigated. Recorded baseline fraud prevalence could be higher in certain groups because they actually commit more fraud or because that’s where past fraud investigations were excessively focused.
Another important limitation relates to the unrepresentativeness of the data we used to run these experiments. We know from internal documents that in the training data around half the people are labelled as having been involved in some kind of ‘illegality’. This means it is unrepresentative of the ‘real world’, where only around 21 percent of people have committed some kind of fraud.
This unrepresentativeness has one direct consequence: the threshold value we used is estimated on the basis of the risk score distribution within the training data. Risk scores in the training data tend to be higher compared to the ‘real world.’ The dynamics, e.g., that there is a greater share of parents than non-parents above the high risk threshold, are likely to be replicated in the ‘real world’ case, however.
In addition, for our controlled statistical parity tests as well as our archetypes, we constructed ‘hypothetical’ people on the basis of the individuals contained in the training data (for instance, by changing their age, gender, etc.). It is possible that some of these hypothetical individuals contain unusual variable combinations (for instance age above 60 and being a parent of a young child), which the model is unlikely to encounter in the real world.
To make sure that we are not biassing our results by running the analysis only on the training data, we re-ran our experiment with synthetic data, which mostly led to similar results as the training data.
Lastly, Rotterdam retrained its model annually with new data, meaning that the results of our experiments could have been different for previous models. The model we have analysed was deployed in the years 2020 and 2021. The final year before use of the system was suspended. Still, many of the variables — including gender and language — have remained the same. When we compared the list of variables between the 2017 - 2018 and 2020 - 2021 models, we found that 70 percent were the same.
Rotterdam’s Response
Rotterdam responded to the results of this experiment explaining that it was working to redesign its risk assessment scoring system to achieve 'maximum transparency, easy to explain and without any appearance of bias.' To this end, the city welcomed our overall findings but declined to share details of the model currently under development. Rotterdam acknowledged it had unintentionally shared a partially anonymized version of the training data for the system and requested we delete the data.
A fundamental challenge recognised by Rotterdam is the range of potential infractions the algorithm is trying to detect. The agency explained that the law requires that 'people on welfare must report changes in their living situation or finances' and that the objective for the agency is to 'quickly discover changes, to point out these "illegalities" to people, to adjust the benefit and thus prevent those entitled to social assistance from receiving too much or too little income for too long,' Rotterdam explained. 'The longer this takes, the more unpleasant the outcome for the resident concerned.'
Rotterdam also explained how the risk assessment system was used in combination with other methods for selecting people for investigation. 'Until 2021, we had three methods for inviting residents on social assistance benefits for an interview:
a random sample (random choice), a thematic study (a study focusing on a specific question) and the risk assessment model.' The data from all three types were fed into the training data, leading to some of the issues of unrepresentative training data we uncovered in our investigation.
Rotterdam acknowledged the validity of the overall findings of bias built into the algorithm and confirmed it came to similar conclusions through its own testing. It confirmed that the model could never be 100 percent “free from bias” or the appearance of it. “This situation is undesirable in itself, especially when it comes to variables that carry a risk of bias based on discriminatory grounds such as age, nationality or gender. Your findings also demonstrate these risks.” According to Rotterdam, it changed the selection of variables four times before finally pulling the system in 2021. Following criticism, it also concluded that the Dutch language variables were an unacceptable proxy for migrant background although it asserts that some Dutch-born Rotterdam residents also have low literacy rates.
Acknowledgements
Throughout the process of developing, executing and writing up this experiment researchers and experts have graciously contributed their time and expertise. We would like to thank: Margaret Mitchell (Hugging Face), Alexandra Chouldechova (Carnegie Mellon University), Cynthia Liem (Technical University of Delft), Jann Spiess (Stanford University), Chris Snijders (Technical University of Delft), Tijmen Wisman (Vrije University Amsterdam), Tamilla Abdul-Aliyeva (Amnesty Netherlands), Nicholas Diakopoulos (Northwestern University), Nripsuta Saxena (University of California), and Nicolas Kayser-Bril (Algorithm Watch) for reviewing our experimental design and methodology.
Appendix
Appendix I. Training Data
In addition to the variables that are used, having representative training data is a major concern in machine learning. Internal documentation indicates that in the training data, the share of individuals who committed fraud is around 50 percent, but in a sample of individuals randomly selected for investigation by Rotterdam, only around 21 percent of Rotterdam’s welfare recipients have been found to engage in some form of illegality. This prompted us to look into the representativeness of the dataset.
Using the limited data publicly available on Rotterdam’s welfare recipient population, we found that the training data contained a striking lack of young people – when being young increases risk scores. People under the age of 27 make up around 6.93 percent of the welfare beneficiary population, so a representative dataset should contain about 880 of them, but in the training data only 0.4 percent, or 52 individuals, fall in this age bracket. This means that the Rotterdam model had very few examples to ‘learn’ from, drastically increasing the likelihood of the model extrapolating from spurious patterns. This is particularly alarming given that age is the most important variable when the model makes its calculations.
Having poor training data is dangerous for another reason: it leads to the codification of real world bias. Machine learning models are designed to learn patterns from the data on which they are trained. If the data on which algorithms are trained are themselves biassed against certain groups of people, which is frequently the case for crime data, the system is likely to learn these analogue biases. For example, studies have demonstrated that Hispanic defendants in the U.S. receive longer prison terms than white defendants for comparable crimes. If a machine learning algorithm designed to suggest term lengths is trained on such biassed data, it would likely learn to discriminate in just the same way. Once the system is deployed, increased targeting of marginalised groups reinforces these biases, a process often described as a ‘positive feedback loop.’
There are strong reasons to suspect that Rotterdam’s model was trained on biassed training data. While we do not know if caseworkers actively discriminated against certain groups of individuals, we do know that the training data is made up of people selected through a variety of procedures, both random and non-random. The non-random procedures include anonymous tips and so-called theme investigations, where certain demographic groups were investigated (e.g., all young men on welfare in a particular neighbourhood).
These selection methods can skew the training data by themselves, even without intention to discriminate. Imagine, for example, that anonymous tips are more effective at uncovering fraud than theme investigations. If women are more likely to be selected through anonymous tips, the algorithm would learn to associate women with illegality. This association would be flawed and fully caused by the difference in how men and women were selected for investigation. While we don’t know for certain which groups were affected by this kind of bias, the construction of the training data makes such outcomes very likely.
Appendix II. Data Preparation
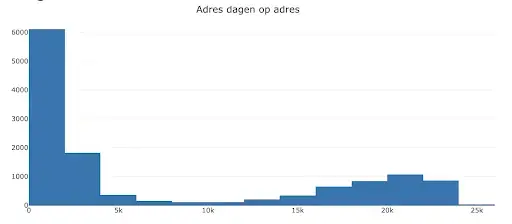
While developing datasets for the controlled statistical parity test was straightforward for most variables, some have some unique quirks to them. Many variables can take on more than 2 values: for instance a recipient can have no children, a single child but also 2, 3, 4 or even more children. In these cases we created one copy of the training data for every possible value the variable can take on for the controlled statistical parity experiment. In the first copy, the ‘number of children’ variable would be set to 0, in the second to 1, and so on. In some cases a variable can take on hundreds or even thousands of distinct values (e.g., one variable measures the number of days a beneficiary has lived at their current address). Creating a separate copy for each of these values would have made it very difficult to interpret the results. Instead, we created copies for a couple of distinct values (in this case 0 days, 1, 10, 100, 1000) to investigate whether we could discern any trends in risk scores as the value of the variable changed.
We discarded the alternative option to use ‘bins of values’ (e.g., date ranges 1-10, 11-100 etc.) since the decision trees underlying the gradient boosting model use exact cutoffs to split the data. Any ‘bin’ risks lying on both sides of the cutoff values, which would have made it more difficult for us to pinpoint which characteristics drive risk scores. At the same time, using exact values means that there are relatively few cases to test in the simple statistical parity set up (e.g., there are very few individuals in the training data who have lived at their current address exactly 1000 days).
The most complex problem was variables whose values depended on the values of other variables. For instance, the dataset contains one variable which relates to parenthood and another which measures the number of children. If the parenthood variable was set to TRUE, the number of children must always be equal to or greater than one. In these cases, it makes little sense to investigate the impact of an individual variable, because, for real people, both variables will always change together. Taking this into consideration, we conducted a single test measuring the impact of both variables at once: in one copy of the dataset we set the parent variable to FALSE and the number of children variable to 0 in the other. Then we created separate copies of the training data, where we set the parent variable to TRUE, and the number of children variable to 1, 2, 3 etc., respectively.
In total, we found more than 130 such dependencies (or ‘business rules’) by analysing Rotterdam’s source code and looking at the training data.
Finally, Rotterdam ‘one hot encoded’ variables, such as those relating to the beneficiaries' district of residence. This means that a single variable in Rotterdam’s source database, which captured the beneficiaries’ district of residence was split up into 9 distinct variables each relating to a single district. These 9 variables can only take on two values: 1 for residents of the district and 0 for those who do not live there. When running experiments on these one hot encoded variables, we tested all of them at once.
We used exactly the same data preparation process with our synthetic dataset. We generated synthetic data by training a Gaussian copula in Python on the training data. We implemented all the business rules laid out above, and the model correctly followed all but one of them. This violation meant that we had to discard 137 rows from the synthetic dataset.
Due to the high-dimensionality of the training data, not all of its patterns (such as pairwise correlations) are perfectly replicated in the synthetic data. Nonetheless, the synthetic data is quite similar to the training data, reaching an overall Quality Score of 85.58 percent. An added benefit of the synthetic data is that it is fully anonymized and can be accessed to replicate our results.
In addition, for the main story, we extracted a sample of 1000 individuals from the training data to illustrate our statistical parity findings for several key variables. The sampling procedure is weighted, such that an equal number of individuals with each characteristic are selected. For example, when looking at gender, the approach will yield 500 men and 500 women. To ensure that individuals cannot be identified based on their exact scores, we added or subtracted a tiny number to each of the scores.
Appendix III. Developing Our Archetypes
Rotterdam’s model is highly non-linear. This means that variables, such as those relating to parenthood, might affect two people’s risk scores (e.g., a man and a woman’s) in very different ways. To explore such interactions and to see how multiple, seemingly innocuous characteristics can, in combination, affect one’s risk score, we developed the archetypes which this story is centered on. One archetype we explored, Sara, is a single mother who is struggling financially. This archetype is made up of variables relating to gender, parenthood, relationship status and financial status. Another second archetype, Yusef, is a migrant man, made up of variables related to language abilities, living conditions, and caseworker comments.
The data generation process for our archetypes was quite similar to the single variable tests. The only difference is that for archetypes we weren’t interested in the impact of a single variable, but multiple variables, instead. For controlled statistical parity, we would have to create a separate copy for every possible combination of variable values that made up the archetype. Each of these copies has a unique combination of the variable values that made up the archetype. For example, for Sara, there is one copy where the gender is set to male, parenthood to false, and the financial status variables indicate no financial problem. In another copy, gender is switched to ‘female’, parenthood to TRUE etc. until all variables match the archetype. Looking at the risk scores as one variable after the other is ‘switched on’ allows us to understand how the different characteristics that make up the archetype interact with one another.
In addition to looking at the impact of these variables across the entire training data, we were interested in how an individual person whose characteristics match those of the archetype would fare. Rather than using a hard threshold to decide who will be investigated and who will not, Rotterdam ranks all welfare beneficiaries and typically investigates 1000-1500 individuals who receive the highest scores. Individuals may not be investigated in consecutive years, however. Assuming that around 30000 people are ranked each year, individuals with the 10 percent highest risk scores are likely to be investigated. This corresponds to the high risk threshold both we and Rotterdam use.
To generate the archetype row we first generated a ‘mode individual,’ whose characteristics match those of the mode in the training data, while making sure that there are no business rule violations. Next, we generated a copy of this mode for each variable combination that make up the archetypes and scored each copy. Now, rather than just looking at the raw score, we placed the archetype scores on a ranking.
Coming up with a ranking was a little tricky. Based on the limited data Rotterdam provided to us, we used a random number generator to come up with 30000 risk scores. These risk scores are normally distributed using the mean and standard deviation Rotterdam provided us. We could then rank the risk scores and place the various archetypes in this ranking to analyse how variable changes would affect an individual person’s placement on the list.