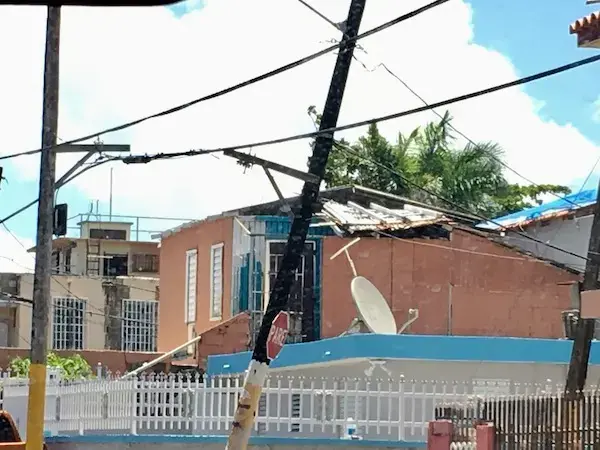
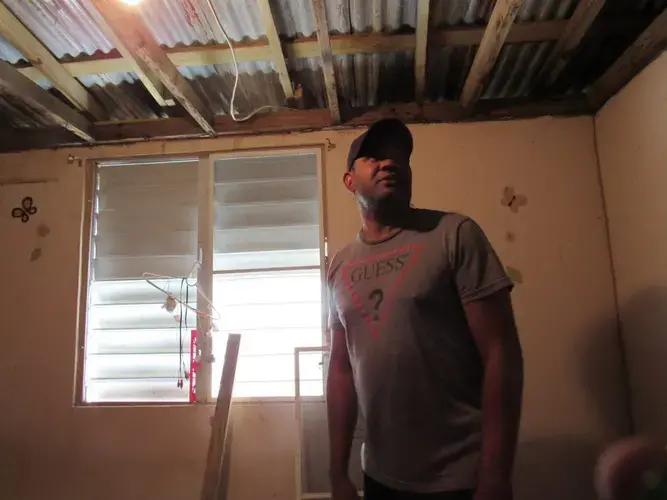
After suffering back-to-back hurricanes in 2017 and an ongoing fiscal crisis, Puerto Rico has seen a...

Click this link to view the interactive map of Puerto Rico created by Kelsey Rydland, Isabel Sophia Dieppa, Martha Bayne and Kari Lydersen with support from the Pulitzer Center and Northwestern University. See below for more context about the variables that can be viewed on the map. This map was created as part of a larger project supported by the Pulitzer Center regarding property rights and vulnerability in Puerto Rico. Click here to view more stories in the project.
Data mapped here includes demographic data from the US Census, foreclosure data from Puerto Rico’s Office of the Commissioner of Financial Institutions’ September 2018 REO Inventory, flood zone data from FEMA, and FEMA’s open data on aid to property owners from Hurricanes Irma and Maria. Data was the latest available as of summer 2019. For questions or references, contact [email protected].
FEMA Aid: Some areas got much more FEMA aid after hurricanes Irma and Maria than others. This had to do in part with severity of damage in different locations, as well as the density of the population and other factors like decisions by or frequency of visits from FEMA inspectors and various sometimes arbitrary factors that affected households’ eligibility for aid. The map shows for example that the San Juan area got relatively high amounts of aid, in total dollars, while largely Afro-Caribbean areas to the east like Loiza got very little.
Residential foreclosures: Residential foreclosures have been a serious problem in Puerto Rico, escalating since Hurricane Maria caused vast damage and saddled people with extensive repair costs at the same time many lost jobs or independent income. The number of residential units in foreclosure is not surprisingly highest in more populated areas like San Juan, Ponce and Fajardo, but foreclosures also have an effect on smaller towns.
Flood zones: FEMA recently updated its flood zone maps, indicating which areas are considered at risk of a flood every 100 or 500 years (1% and 0.2% risk zones, respectively). Across the country increased rains linked to climate change have thrown a wrench in flood predictions based on data collected over decades. While more updated and accurate predictions are considered an important way to prepare for and adapt to the impacts of climate change, the designations also have implications for residents. Getting insurance and loans can be harder or impossible if an area has a higher predicted risk of flooding. And the rules for disaster aid under the federal Community Development Block Grant program prohibit some homeowners from using aid to rebuild in a flood zone. As the different federally-designated categories portrayed in the map show, flooding can be caused by different factors including rivers swollen by rain and high coastal waves driven by both increased storms and elevated sea level caused by climate change.
Median income: Puerto Rico’s median income island-wide was just over $19,000 a year in 2018. That compares to over $63,000 in the US as a whole. Mississippi, the US state with the lowest median income, came in at $42,781 in 2018. As the map shows, even though median income for nearly all parts of Puerto Rico is low by mainland standards, there is still great variation across the island. Zoom in and click on different parts of the map within to see variation by census block group, a geographic area smaller than towns or counties.
Race: The racial and ethnic makeup of Puerto Rico is shaped by centuries of history from the Taino and other indigenous people to Spanish and later U.S. colonization and the slave trade. Loiza just east of San Juan for example has a largely Black, relatively low-income population, who are trying to hold on to their land and cultural heritage even as some community leaders fear a land grab by developers or wealthier people from on or off the island.
Vacant versus occupied housing units:
In recent years Puerto Rico has suffered a hemorrhaging of population, driven in large part by austerity measures and other impacts of the debt crisis, and damage from Hurricanes Maria and Irma. When people leave in high numbers, housing units are more likely to remain vacant, potentially causing a safety risk, depleting the local tax base and sometimes contributing to a feeling of abandonment and disinvestment for neighbors. In areas potentially ripe for tourism- or tax-shelter-related development, vacant homes could also be fodder for developers looking to pick them up cheaply and turn a profit, but in ways that may not contribute to the stability or sense of community of the neighborhood.
Owner- versus renter-occupied housing units:
Though Puerto Rico’s median income and other economic indicators show it is generally faring worse than the mainland US in financial terms, rates of homeownership in Puerto Rico are relatively high. Island-wide, about two-thirds of housing units are occupied by owners, roughly the same portion as US-wide. But in the US as a whole, lower-income areas usually have lower owner-occupancy rates, as it is hard for low-income people to amass the capital and credit needed for homeownership. Hence Puerto Rico’s owner-occupancy rates don’t comply with nationwide trends given the island’s income levels. The relatively high owner-occupancy rates have much to do with the deeply rooted, multi-generational families and communities that are common in Puerto Rico even in low-income areas. And this contributes to the island’s social resilience even in the face of crises like Hurricane Maria. Official owner-occupation figures are also likely an undercount since many Puerto Rican homes are passed down informally between generations of family members, without official deeds or documents. As more people flee the island for economic reasons however, and others lose homes to foreclosure, the high rate of owner-occupancy may change. Owner-occupancy is often considered desirable for both individual families and larger communities, as owners build financial equity and generally may have a greater longevity and hence a deeper stake in a given community.