Journalist Resource
 October 29, 2025
Investigating When Data Isn't Available: Lessons From the Arabian Gulf

Who benefits from and who bears the costs for desalination plants?
At a scientific conference, I found myself among researchers proudly presenting the Arabian Gulf’s dominance in global desalination capacity. To many in the room, it was a story of success—proof that technology could overcome nature’s limits in a thirsty region. But as an investigative journalist, I left with uneasy questions. Desalination means extracting enormous amounts of seawater to produce freshwater, yet could the process really be free of environmental consequences? Was there a hidden cost behind every drop?
This is how the project The Cost of Fresh Water in the Arabian Gulf was born: a four-part series combining data analysis with human storytelling and raising critical questions about the future of desalination in the region, also known as the Persian Gulf. In this article, I share the behind-the-scenes journey: how we carried out the project, what I learned over 18 months of reporting, the obstacles we faced, and how we overcame them.

As a nonprofit journalism organization, we depend on your support to fund more than 170 reporting projects every year on critical global and local issues. Donate any amount today to become a Pulitzer Center Champion and receive exclusive benefits!
The hypothesis
Once my Ocean Reporting Network fellowship with the Pulitzer Center began, reality set in. The Gulf’s six nations follow vastly different policies, use varied technologies, and publish inconsistent data. Covering them all would have required a large, multidisciplinary team—far beyond the scope of a single fellowship.
I decided to narrow the focus. The goal became identifying where desalination dependence is greatest, where the environmental toll is most visible, and which communities are paying the price. To do that, I first had to understand desalination technically: How exactly does it pollute the sea?
I consulted engineers, reviewed plant operation systems, and spent weeks studying scientific papers, interviewing marine researchers, and mapping out a preliminary plan—including a contingency strategy that later proved crucial.
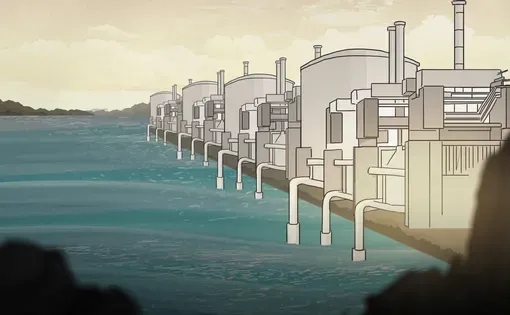
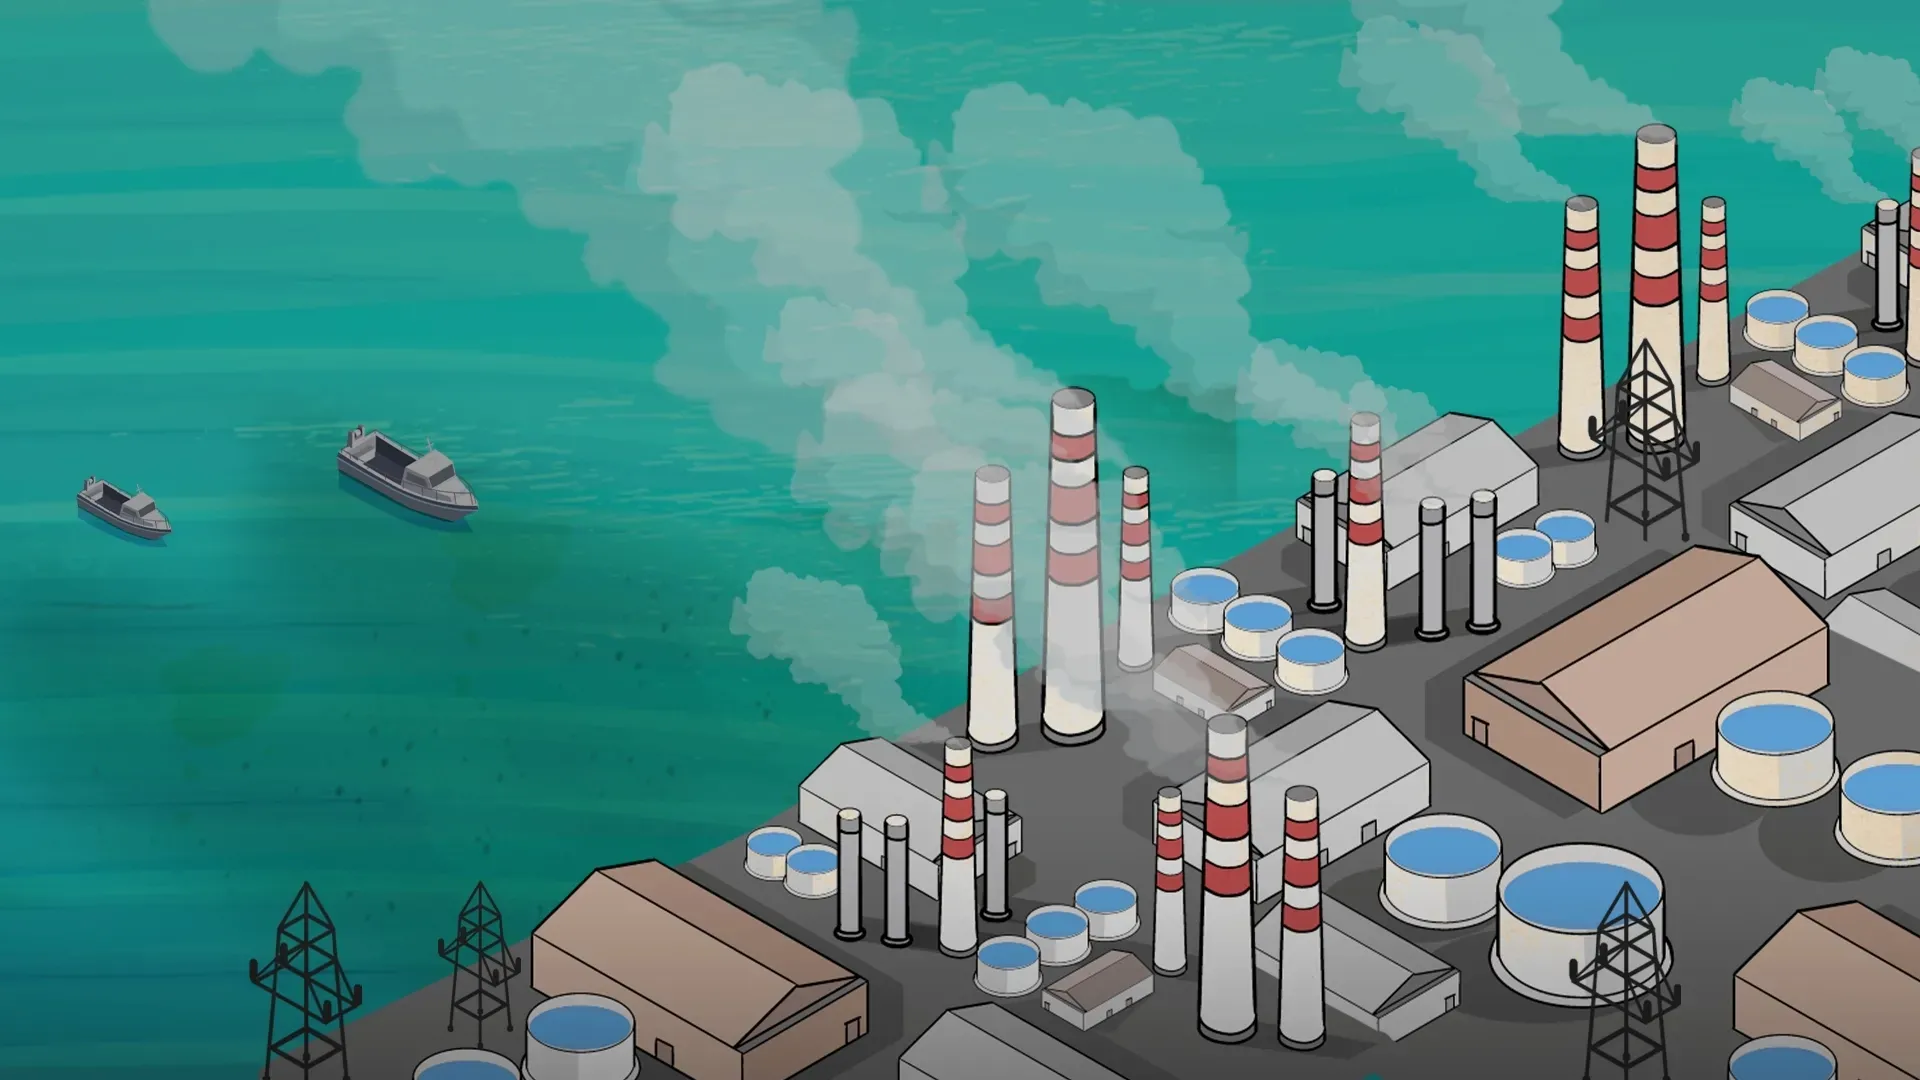
The hypothesis soon became clearer: Gulf states are rapidly expanding desalination capacity using seven main technologies, most prominently reverse osmosis. All discharge concentrated brine—hotter, saltier water—back into the Gulf. This accumulation raises salinity and temperature in an already fragile ecosystem, threatening coral reefs, marine life, and the livelihoods of coastal fishermen.
Data sources
The Arab region faces a chronic shortage of reliable data and significant barriers to accessing it. Freedom of information laws simply do not exist, with rare exceptions like Tunisia and Morocco. Even where data exists, journalists face suspicion and obstacles.
In the Gulf, official information was almost impossible to obtain. The Gulf Cooperation Council offered only broad statistics—useful for context but lacking key investigative details like plant locations, capacities, technologies, and ownership.
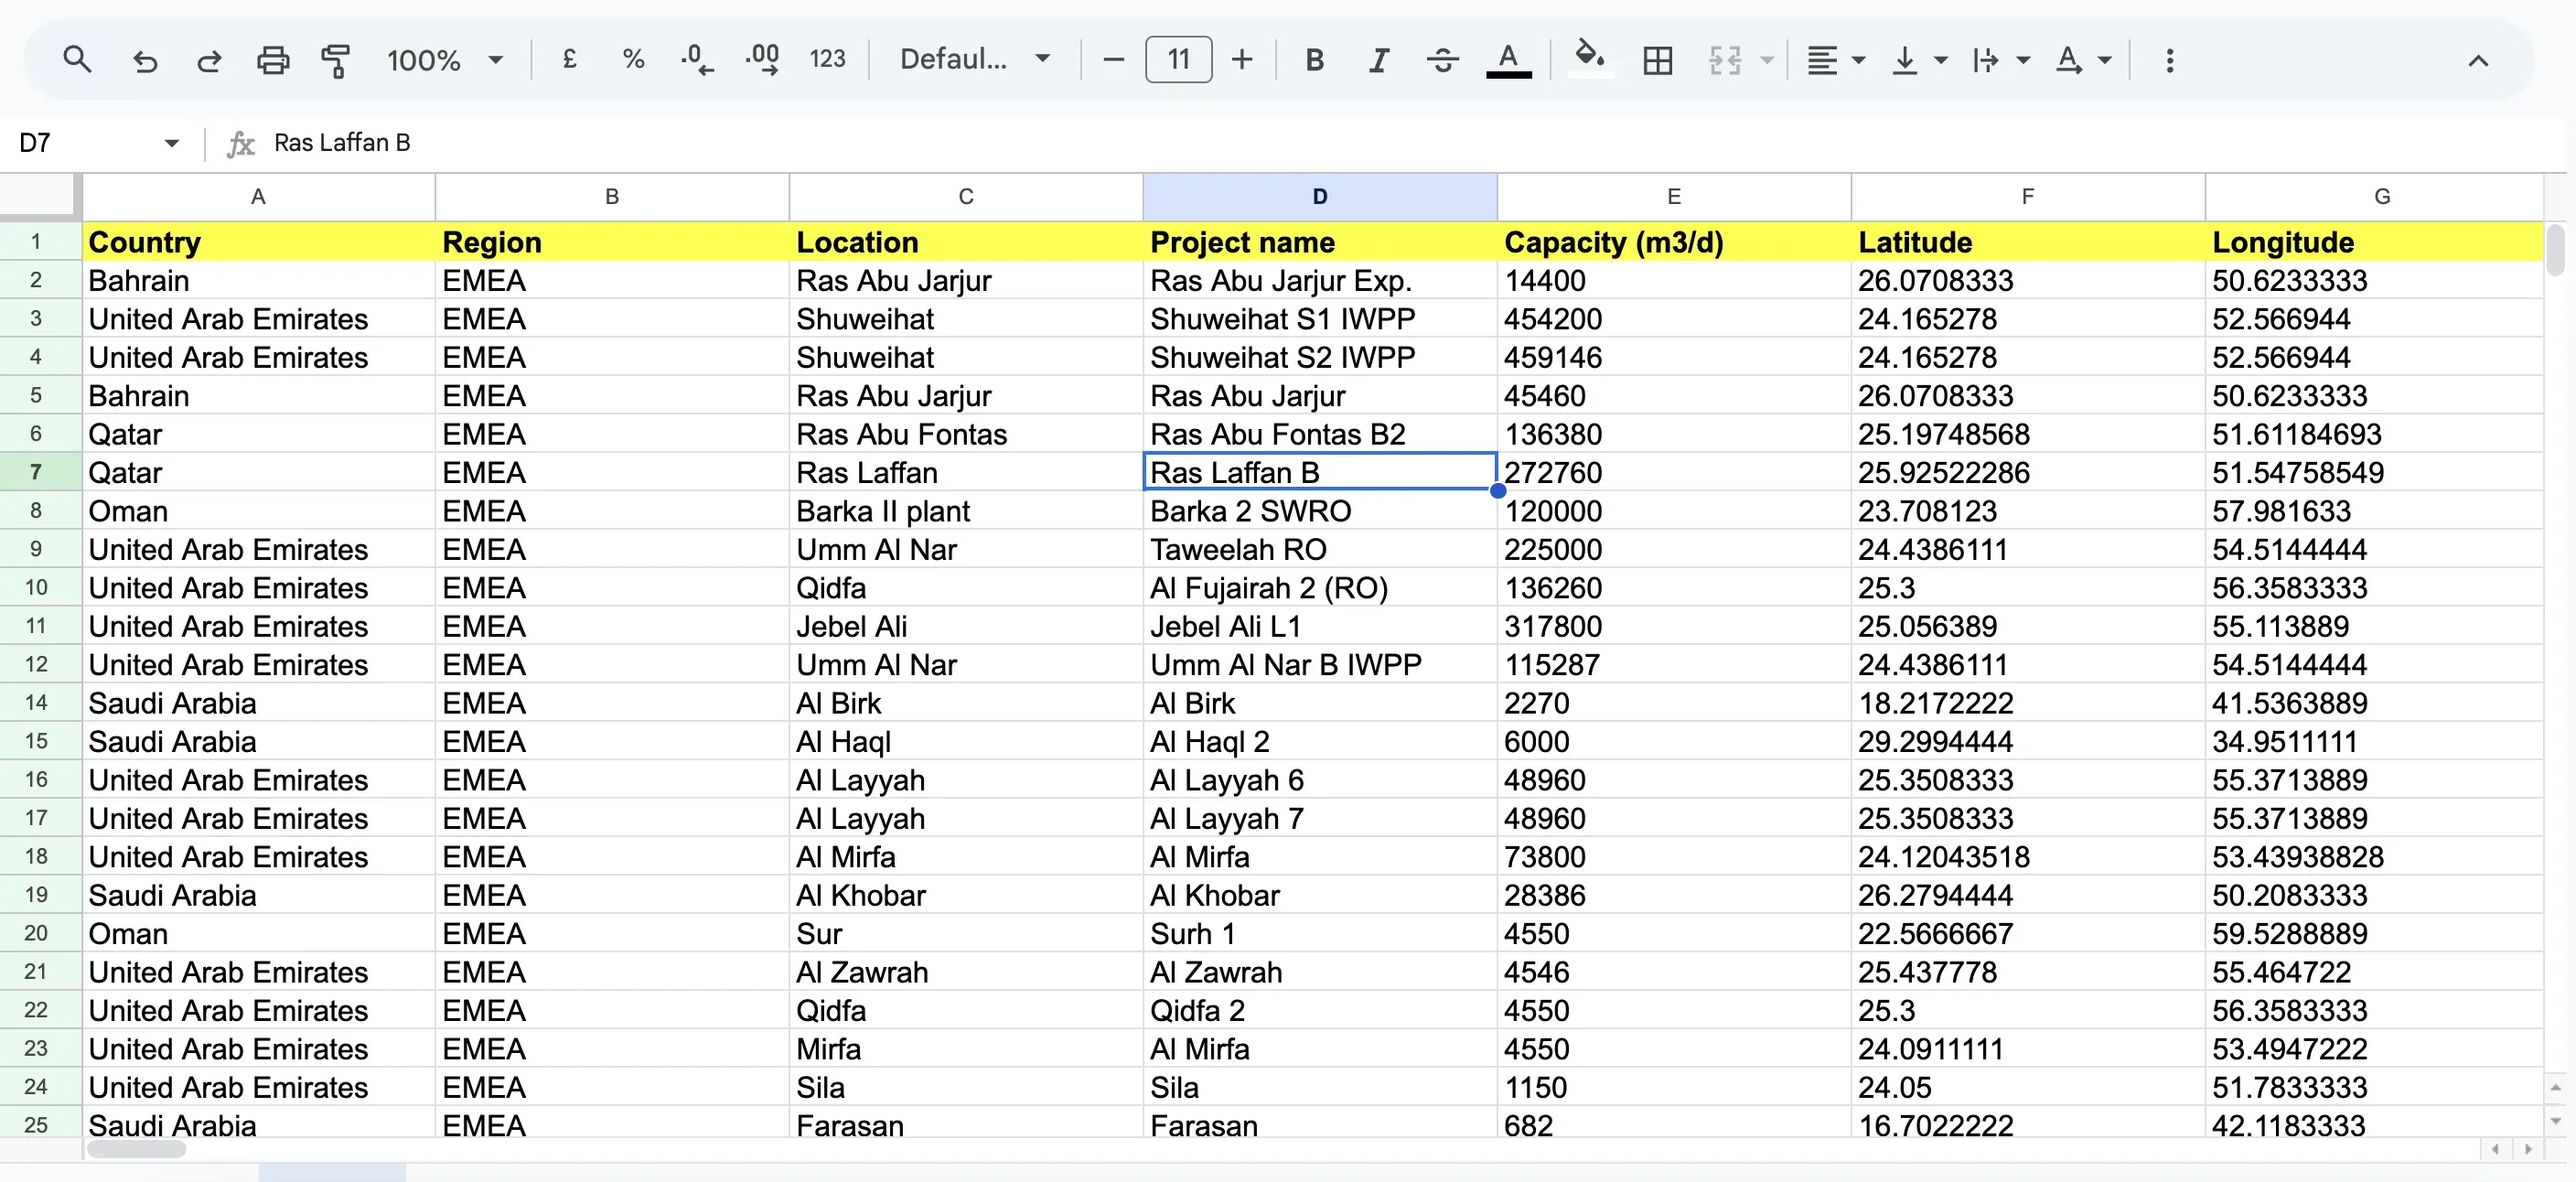
The breakthrough came when I found Global Water Intelligence, a private company which hosts one of the world’s most comprehensive desalination databases. Though the subscription exceeded my budget, after six weeks of negotiation I secured access at a reduced rate. Opening the dataset was like revealing a hidden map. It showed every Gulf desalination plant, its technology, output, and operator, allowing me to form the backbone of the investigation.
Methodology
To prove the hypothesis, I had to return to the traditional method of breaking down the hypothesis into basic questions: issue, cause, effect. I determined how I would answer them and what tools I would use to prove each part.
(1) The cause
To show desalination’s environmental impact in the Gulf, I began with a database of 70,000 desalination plants worldwide. Using Google Sheets, I cleaned and filtered the data to include only the six Gulf countries, then used QGIS, an open-source geospatial mapping tool, to locate plants along the Persian Gulf and Arabian Sea. The final dataset contained 815 plants, highlighting the region’s dense desalination footprint and the environmental implications often overlooked in policy and public debate.
Using pivot tables in Excel, I analyzed this refined dataset to answer key questions:
- How had desalination capacity evolved until 2023?
- What share of global capacity does the Gulf hold?
- Which countries and companies dominate the sector?
- What technologies are most used, and for what purposes (domestic, industrial, or tourism)?
- Is desalination primarily state-run or privatized, and under what contractual systems?
To make the data tangible, I collaborated with an expert to turn the figures into clear comparisons—such as the number of Olympic pools produced daily or their total length if placed end to end.
This analysis became the roadmap for my fieldwork, showing where the environmental impact was most severe and which countries required deeper investigation.
(2) The issue
The investigation ultimately focused on brine—the hypersaline, heated wastewater discharged back into the sea by desalination plants. This byproduct alters the ocean’s salinity and temperature, threatening coral reefs, marine life, and fishing livelihoods.
Initially, I planned to collect and analyze water samples near plant outfalls, as I had done in past investigations. In the Gulf, however, this required complex security permits that were impossible to obtain.
Instead, I turned to peer-reviewed scientific studies that had already analyzed or modeled brine discharge in Gulf waters. To interpret these findings, I interviewed marine scientists and researchers—though reaching them was not easy. Of every 10 I contacted, only one replied.
Before citing any study, I verified its credibility and methods—checking data collection, sample size and duration, funding sources, comparability, recency, peer review status, and author reputation via Google Scholar.
This critical review process ensured that every claim in the project rested on verifiable, scientifically sound evidence.
(3) The effect
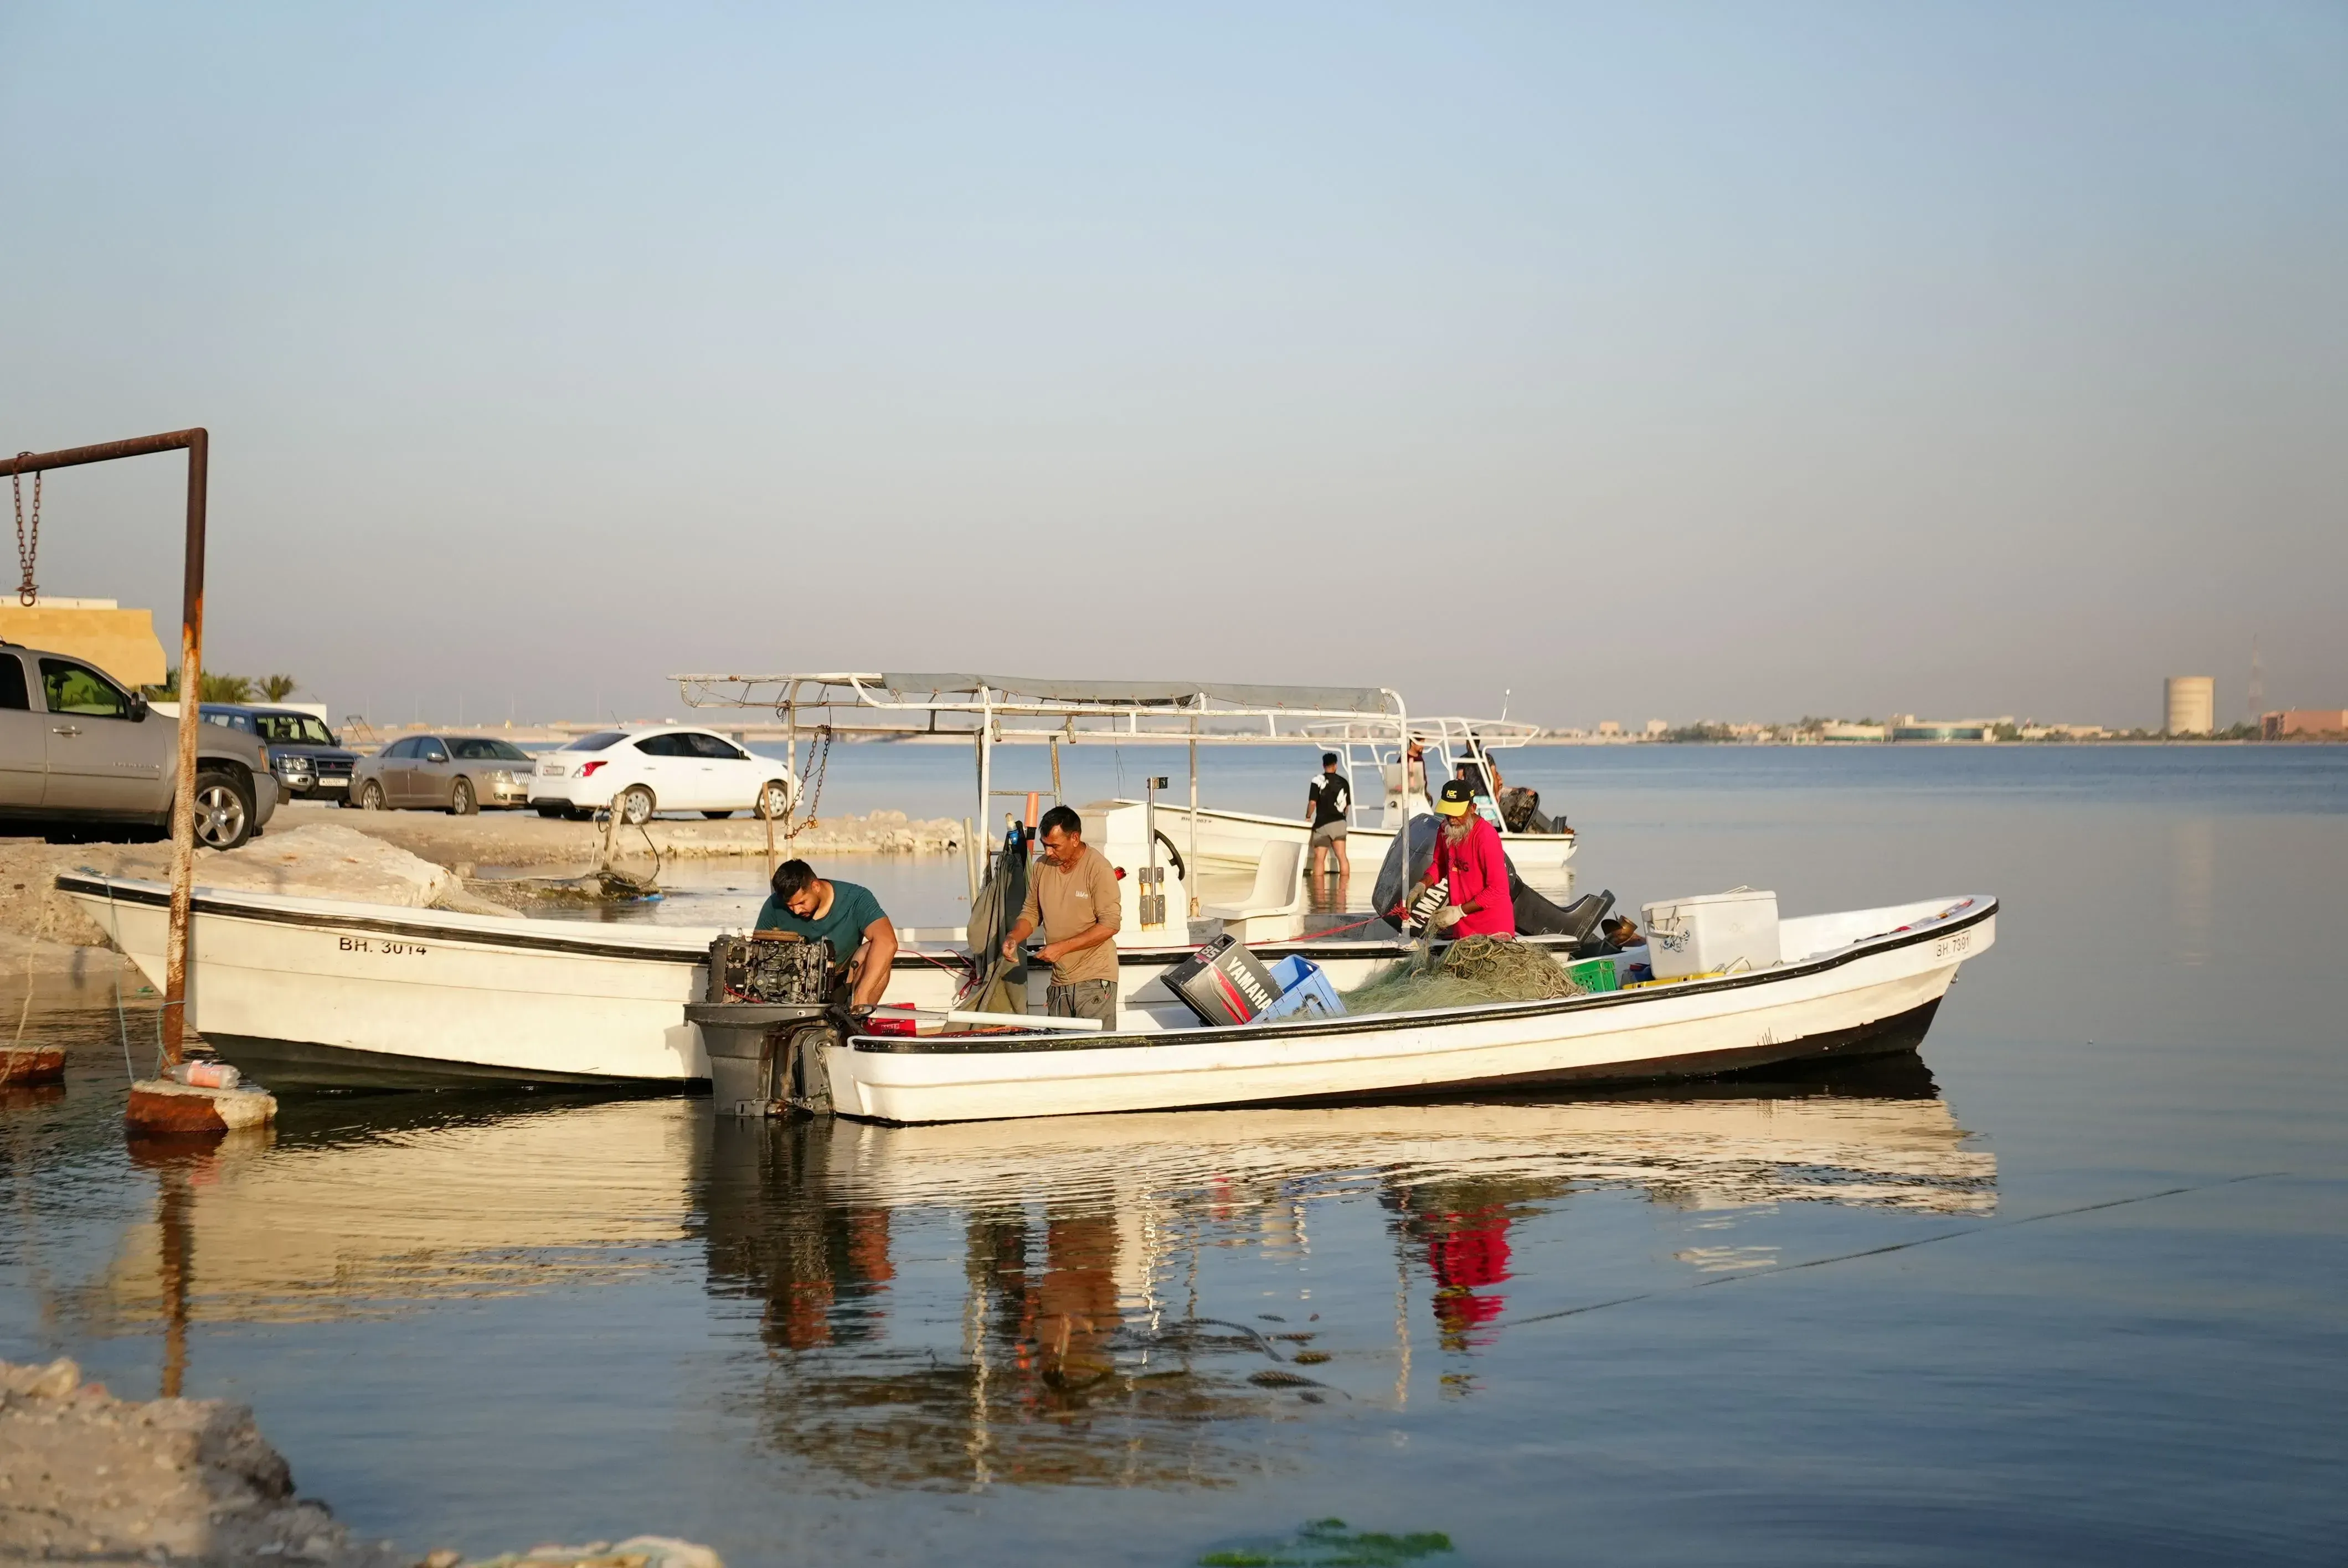
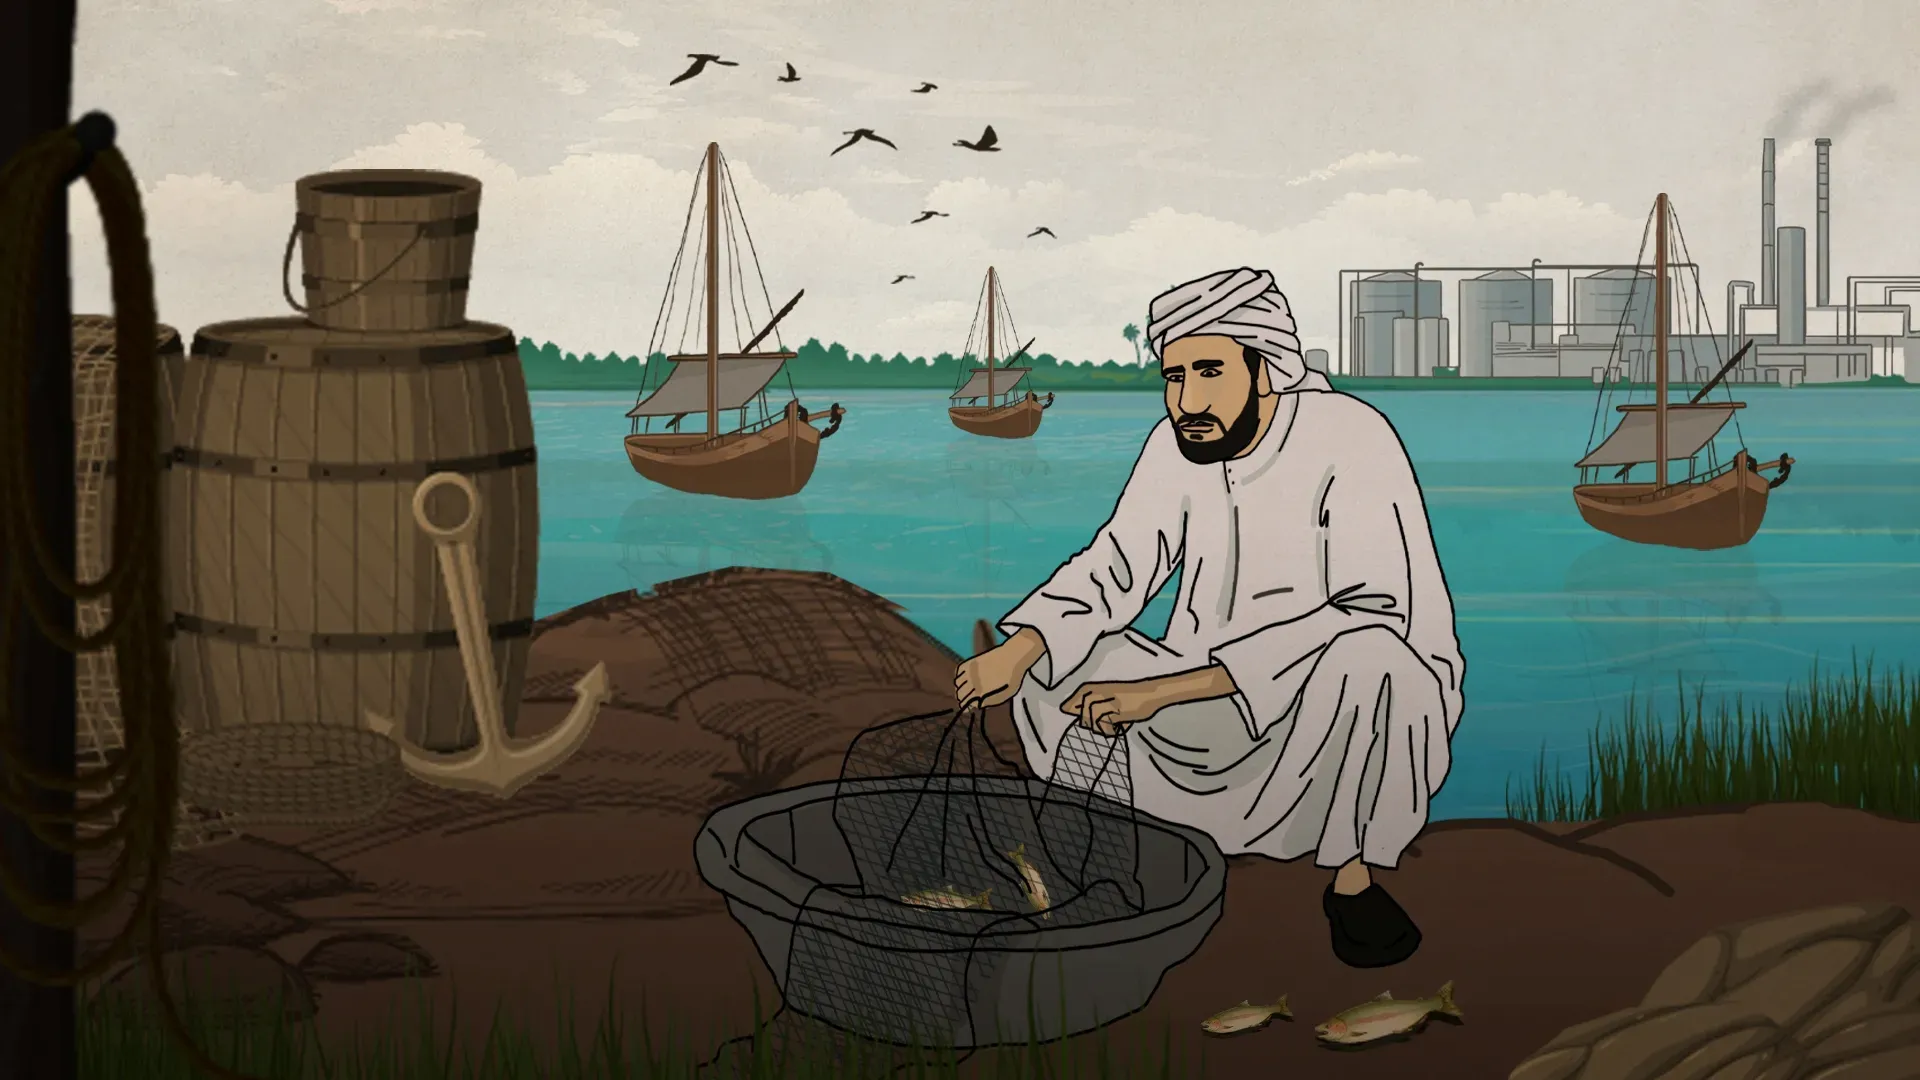
The effect was clear: brine discharge, saltier and hotter than the surrounding water, changes the properties of the ocean and affects everything living in it. Fish populations declined, some species disappeared entirely, and coral reefs and seagrass were damaged—a direct impact on fishermen who had spent their lives in this Gulf.
To prove the decline in fish and fishermen, I relied on two main sources:
- Official data: I obtained statistics published by Gulf governments on fisheries resources. Most of these datasets were in PDF format. To convert them into analyzable tables (CSV), I used simple tools such as Tabula, Pinpoint, and I Love PDF.
- Fishermen’s testimonies: Accessing fishermen proved to be a much greater challenge. At first, I planned to work in Saudi Arabia and Kuwait. I worked with a local reporting partner to try to secure information and conduct filming, but we could not obtain anything substantial enough to build on.
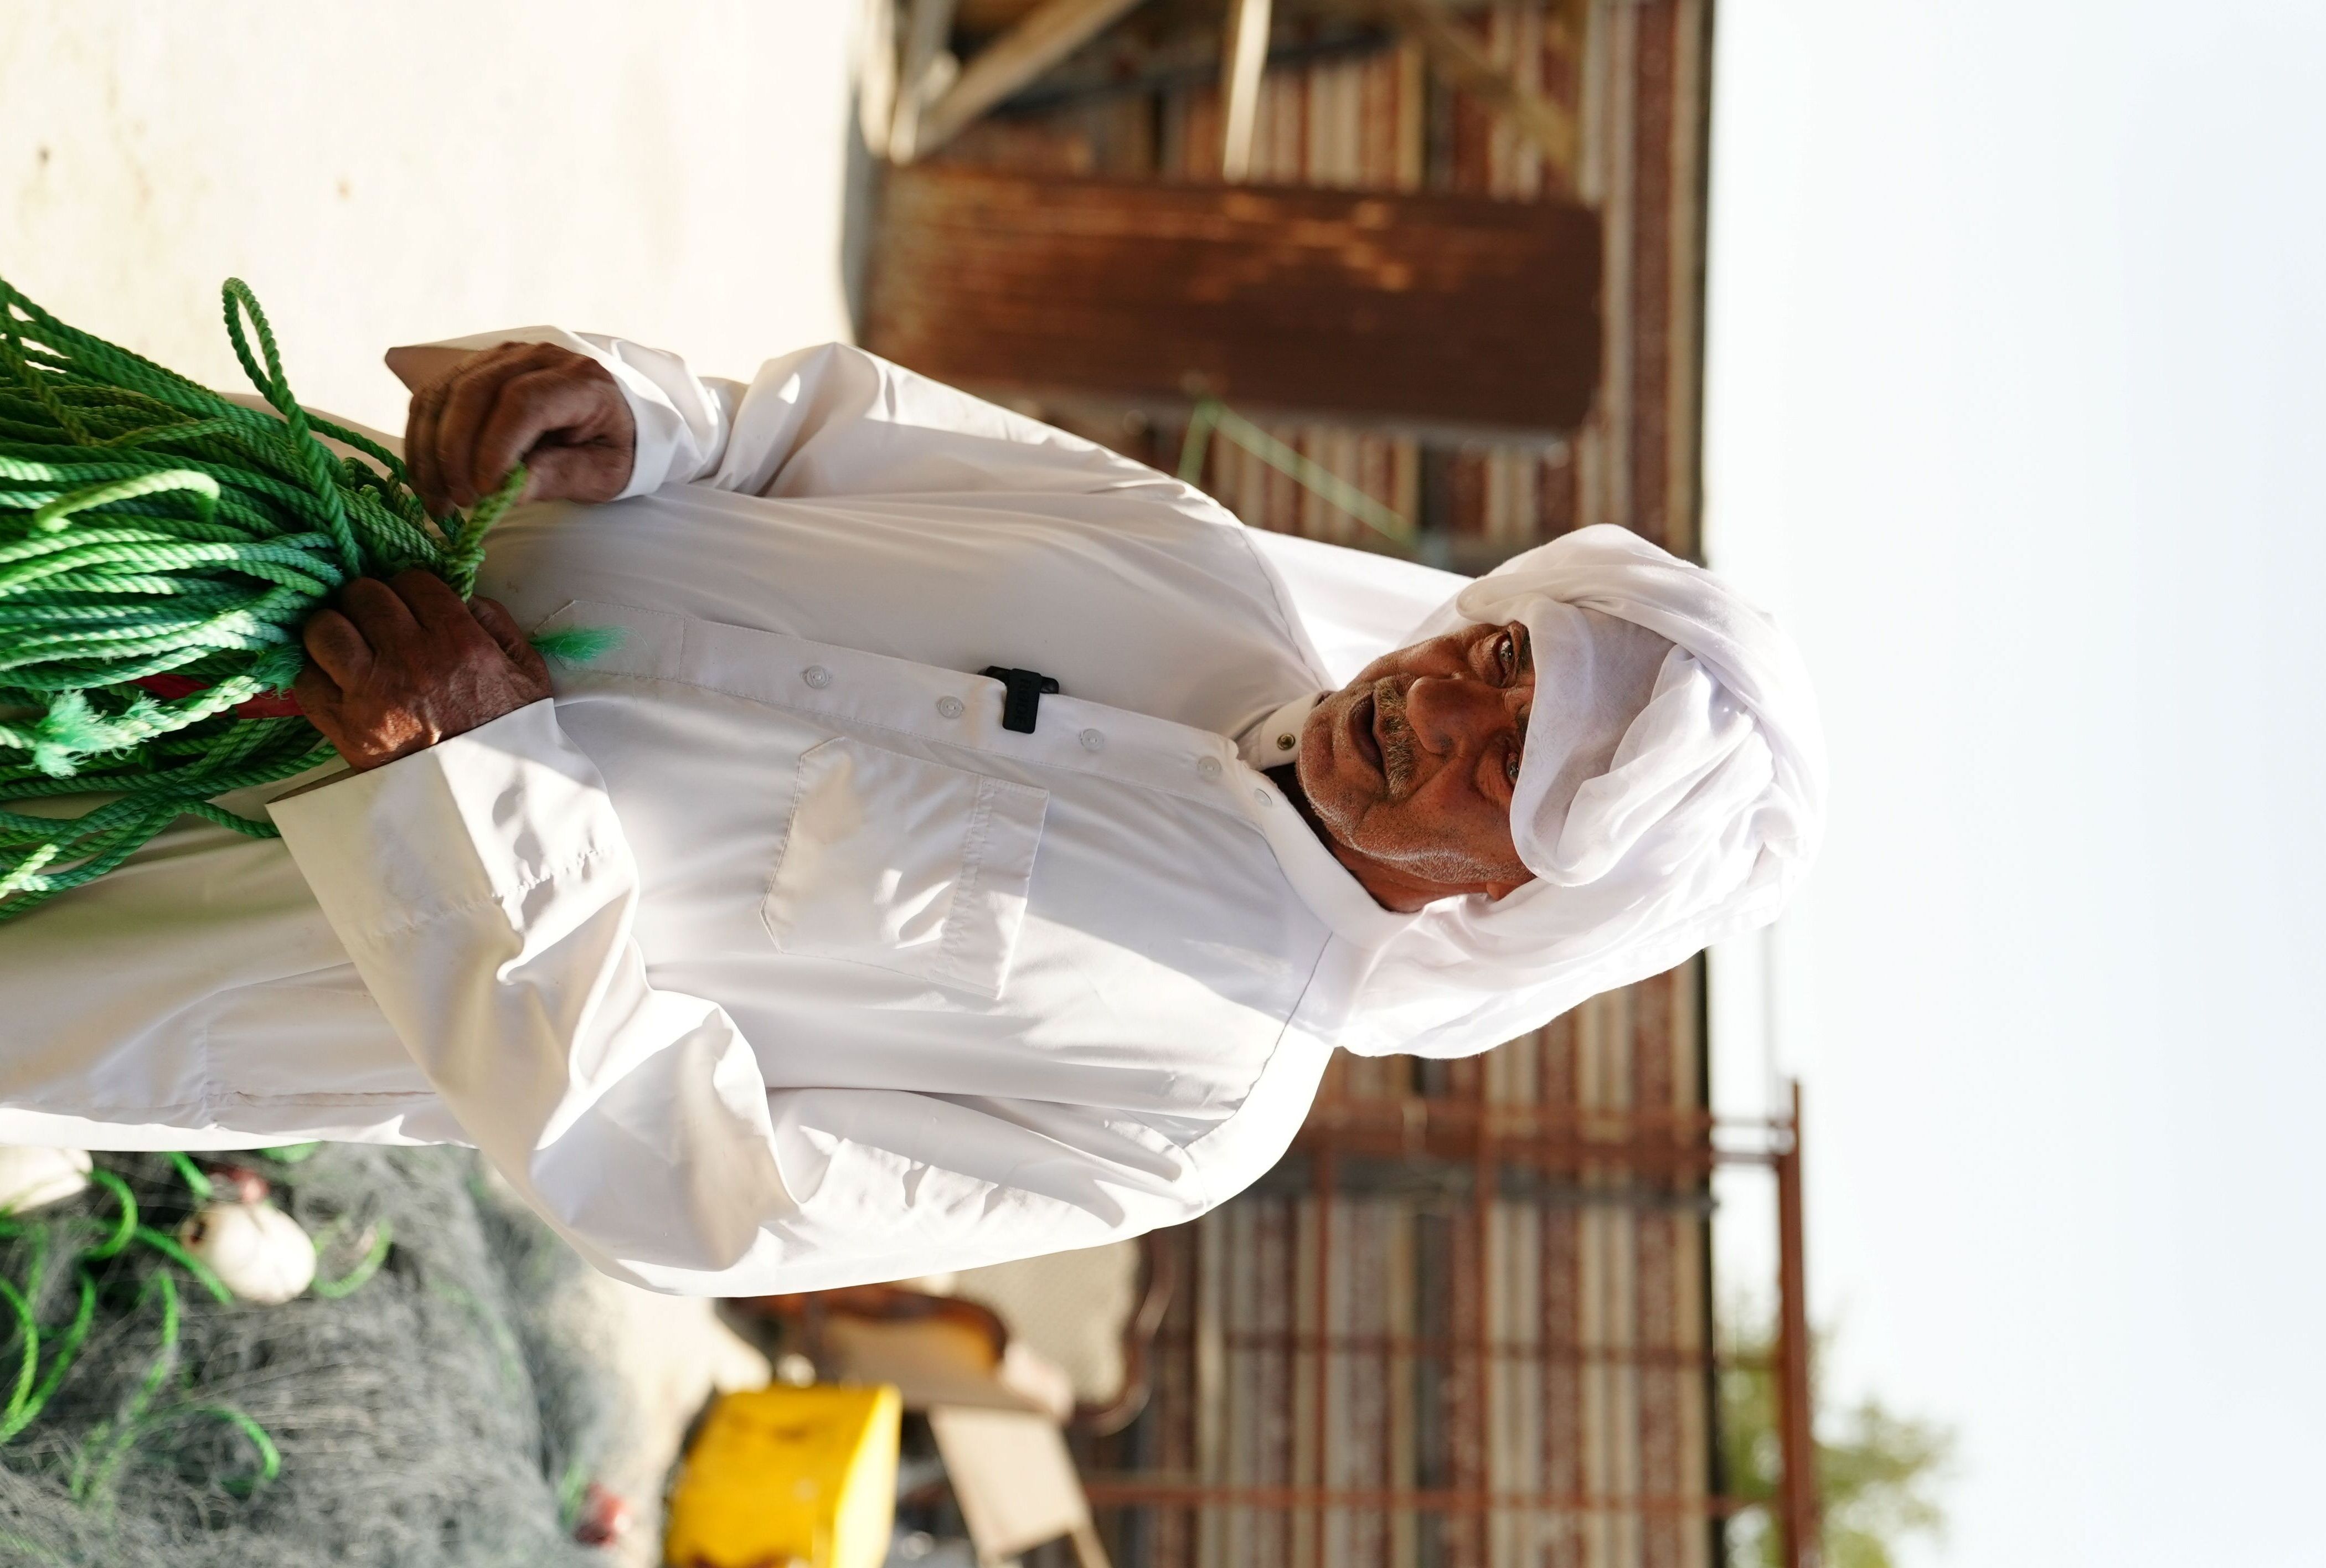
After three months of failed attempts, I shifted to Bahrain and Qatar, where local reporting partners assisted. In Bahrain, with journalist Alyaa Almosawi, we faced repeated refusals before finally documenting fishermen describing desalination’s impact on their livelihoods. In Qatar, it took five months of persistence to film one fisherman who agreed to share his story during a night fishing trip.
Designing the investigation
After completing the journalistic work and the field and data research, we began to think about how to present the investigation to the reader in an engaging and interactive way. Here came the role of collaboration with a multidisciplinary team: illustrator and designer Sahar Issa, an interactive page designer, and a developer responsible for implementing the technical side.
Through our extended discussions, we developed a visual and structural concept for the project. Sahar began drawing the illustrations and visual panels that reflect elements of the story, while the designer started building the interactive pages. I was responsible for organizing the data and designing it visually using tools such as Flourish and Datawrapper. The developer, meanwhile, undertook the task of connecting all these elements and making them move smoothly to give the reader an immersive and engaging experience.
Lessons learned
I learned to approach complex, data-heavy topics with creativity and persistence, even when access barriers seemed insurmountable. Mastering tools like QGIS taught me how to transform raw data into meaningful visual stories, bridging the gap between science and journalism.
This project taught me to see challenges as part of the process. Limited access to field data and direct sampling made the work harder, but it ultimately strengthened the project—pushing me to refine my verification methods, seek creative alternatives, and collaborate across disciplines to maintain accuracy and credibility.
Replicating the methodology
This approach isn’t limited to the Gulf—it can be applied anywhere desalination is growing, from Spain to Australia or the U.S.
Key lessons:
- Start with data—it guides fieldwork.
- Verify constantly through multiple sources.
- Understand the technology; talk to engineers.
- Stay flexible—each context is unique.
- Build local networks early.
The next step is to expand this work globally, exploring whether desalination’s impacts differ across regions and sparking a wider conversation about the true cost of fresh water.