Pulitzer Center Update May 26, 2016
New 2016 Global Health Model Lesson Plans


Project
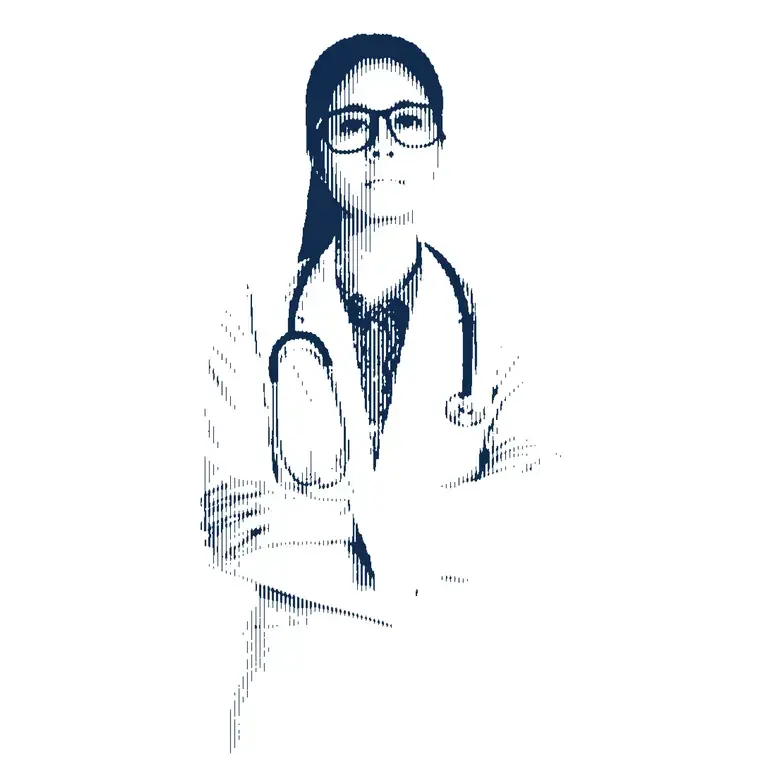
Saving Kenya’s Mothers
Kenya continues to lose 7,000 mothers to preventable deaths each year. If the solutions are known...


As part of ongoing efforts to expand the use of top-tier global health reporting in universities and schools, the Pulitzer Center has partnered with higher education faculty and K-12 teachers to design example lesson plans on journalism and public health. Using Pulitzer Center resources, including articles, videos, public radio stories and photography, model lessons train students to analyze, debate, critique and compare science communication techniques.
These 2016 model lessons have been prebuilt by the Pulitzer Center's education team and are available for teachers and professors to use:
- "Global Health Journalism: A Powerful Tool for MPH Students" – This lesson draws on public health journalists' reporting for NPR, PRI's The World, Humanosphere and The Seattle Times to explore story pitching, reporting and even the ethics of global health coverage.
- "Tuberculosis: A call to action" – This lesson explores the role of visual journalism in communicating global health issues, using original articles from CNN, Science Magazine, Al Jazeera and Nature. Through the lesson, students investigate the implications of visual media coverage on global health policy change, comparing coverage of TB to that of HIV, malaria and other diseases.
- "Tracking Aid Money: Engaging With the Work of Amy Maxmen" – This lesson guides students through a detailed analysis of Amy Maxmen's groundbreaking Newsweek health financing investigation, examining how it compares and contrasts with academically published health financing research.
- "Telling Science Stories: Data Visualization" – In this lesson, students learn how increasingly advanced data visualization methods make it easier to communicate and understand quantitative data in an accessible way. The lesson draws upon three Pulitzer Center-supported data visualizations and teaches students basic online mapping platform techniques to create visualizations of their own.
By joining our educator community, you can use or adapt these science communication lessons for your classroom, or better yet, create your own.

Research during a disaster can seem frivolous when there aren’t enough resources to handle the...

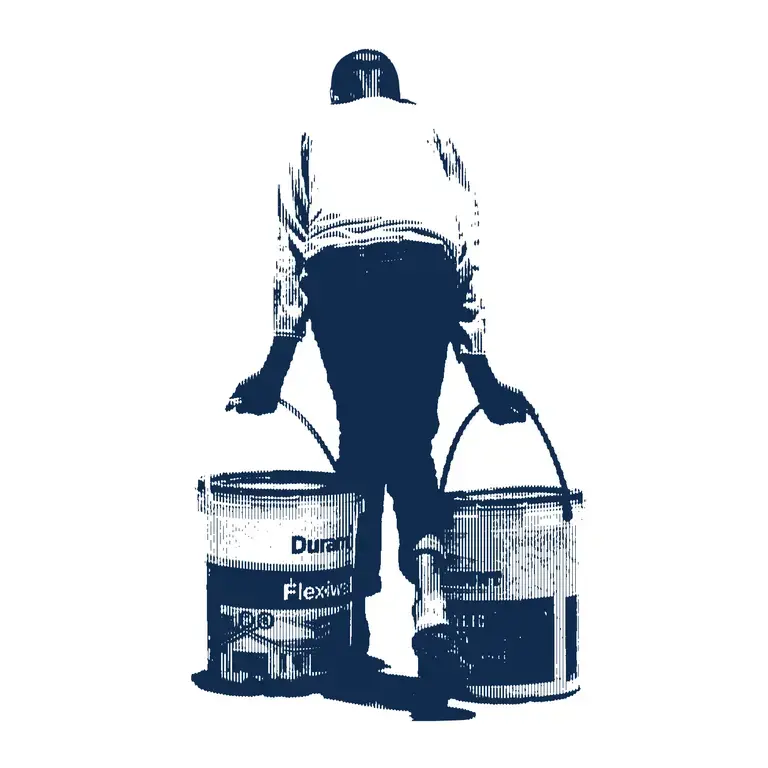
Vietnam has less than 30 percent of the funding needed to fight tuberculosis. With only the most...


Project
Cholera: A Tale of Two Cities
The cholera epidemic that hit Haiti four years ago bears some startling resemblances to one that...