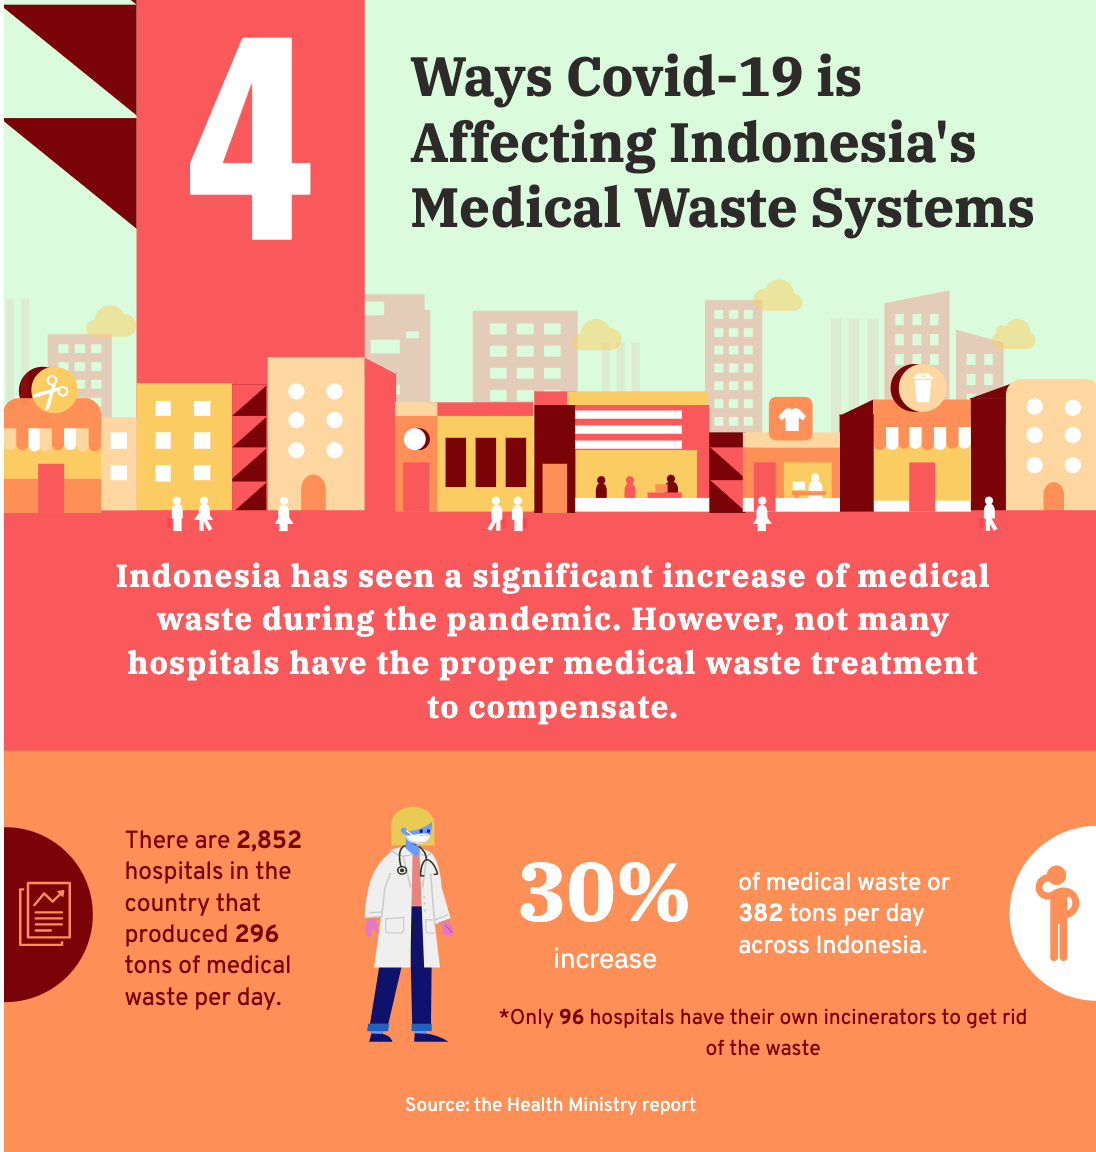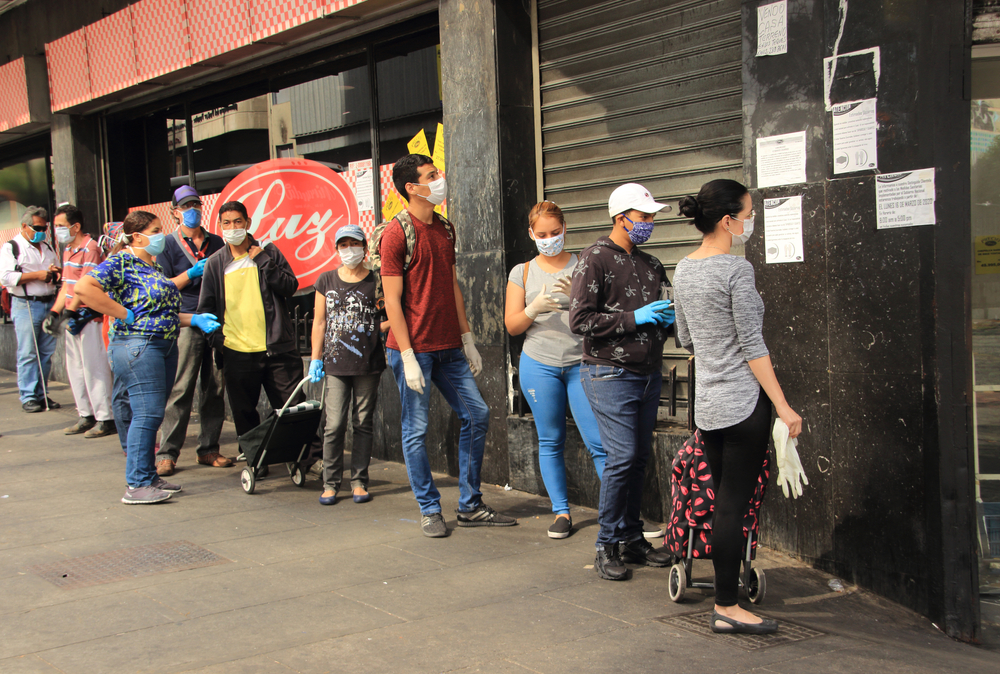
This unit was created by Susan Zoë Greenwald, a high school mathematics teacher in Cheltenham, PA, as part of the fall 2020 Pulitzer Center Teacher Fellowship program on Media, Misinformation, and the Pandemic. It is designed for facilitation across approximately five 60 minute class periods.
For more units created by Pulitzer Center Teacher Fellows in this cohort, click here.
Objectives:
Students will be able to…
- Day 1
- Define the term "under-reported story" and explain the importance of under-reported stories in journalism.
- Explain how and why journalists use descriptive statistics to help tell an under-reported story.
- Explain the importance of using and citing accurate data and descriptive statistics in journalism.
- Day 2
- Describe how under-reported stories are told in mediums other than written articles such as videos and podcasts.
- Describe how a personal story helps readers better understand Covid-19 data.
- Find descriptive statistics in written articles and decide upon preferred visualizations and graphics to display statistics.
- Day 3
- Identify interesting data visualizations.
- Determine an article of interest and find descriptive statistics in the article.
-
Decide upon and begin the creation of a graphic to match their chosen article. Students will complete their graphic after this class period at home or during class if there is enough time.
- Day 4
- This lesson is a project work session. During this class students will prepare their reflections about the graphic they created. By the end of class students will complete their first draft.
- Day 5
- Students will celebrate the completion of their project and share with classmates, community or a wider audience.
Unit Overview:
Students will evaluate underreported news stories about the coronavirus pandemic in order to analyze the way that descriptive statistics are designed to communicate the impacts of the pandemic. Students will create a descriptive statistics data visualization to go with a chosen underreported news story about the impacts of the coronavirus pandemic. They will reflect on their graphics journalistically, mathematically and personally. They will then combine their information into a final project like this. Students' projects will be housed in a living visual document similar to this.
Resources for Facilitating this Unit:
Click here for a PDF outlining lesson plans for this unit, including warm-ups, resources, discussion questions, activities, and performance tasks for the unit.
Click here for directions to the unit project. These directions are also included in the PDF.
Click here for all teaching materials needed for the unit.
Performance Task:
This unit culminates in a descriptive statistics data visualization to go with a chosen under-reported story about the impacts of the coronavirus pandemic. Download the complete unit plan for instructions, a rubric, and other resources. Click here to see an example of a final project graphic.
- View examples of student work here: Select Student Work
Assessment and Evaluation:
-
Students receive this rubric at the start of the project to understand how their work will be evaluated. This rubric will then be used to evalaute their final projects.
- At the conclusion of the unit, students will answer the following questions as part of a closing reflection:
- What did you learn about under-reported stories from your project?
- What did you learn about descriptive statistics and the impact of including descriptive statistics in a news story?
- What is your assessment of this project?
- What would you change or add to this project?


