Story
 April 23, 2021
Maps: See Which Bay Area Locations Are at Risk From Rising Seas
Country:

Local governments along the San Francisco Bay Area coastline are confronting the reality of sea...
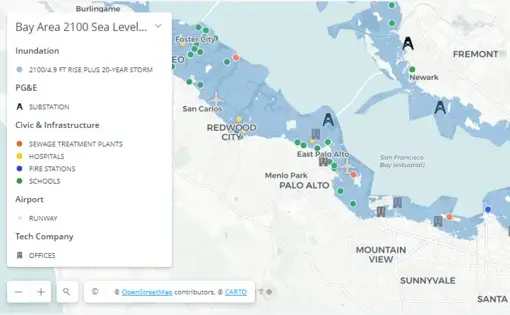
Use your mouse to move different directions on the map. Use the + and - signs to zoom in and out. Click on the magnifying glass at the bottom to search for a specific address. Click on the down arrow top right of the legend to remove it. Sources: USGS, OCOF, Pacific Institute
The bay’s high tide level is going in one direction: up. Models used in the state's latest sea level rise assessment, from 2017, include an upper range defined in terms of statistically less probable events. They show the bay could rise by up to 1.9 feet by the year 2050 and 6.9 feet by the end of the century, which are greater than the levels shown in the two maps on this page.
But it could get even worse: Cities preparing for future flooding also have to worry about several additional feet of water crashing against their shorelines during a bad storm.
Already during storms, East Palo Alto and other cities along the shoreline experience coastal flooding and erosion, which will only be exacerbated by the coming rise in sea level.
“Rising seas is one of the most certain of the effects of climate change,” said Mark Stacey, a UC Berkeley environmental engineer. “We know much of that is already baked in, and we know the seas are going to continue to rise at pace and perhaps accelerate in the coming decades.
Differences in scientific modeling scenarios before the year 2050 are minor, but they diverge significantly after mid-century depending on the trajectory of greenhouse gas emissions, which human beings will determine, and the fate of ice sheets in Greenland and Antarctica.
Use your mouse to move different directions on the map. Use the + and - signs to zoom in and out. Click on the magnifying glass at the bottom to search for a specific address. Click on the down arrow top right of the legend to remove it. Sources: USGS, OCOF, Pacific Institute
These models don’t incorporate a more extreme scenario, in which ice sheets in Greenland and Antarctica collapse. If this occurs, the Bay Area could see 10 feet of sea level rise by 2100 — what Stacey calls a “massive acceleration" that's 30 to 40 times faster than the rate of increase we've experienced over the last century.
“This goes beyond the scope of what we've thought about in planning horizons in terms of the magnitude of change that we'd be facing as a region,” he said, adding that such an increase would require a “complete rethinking of the community surrounding the entire Bay Area, and a move of infrastructure systems that would be pretty profound.”
The state's assessment says: “Aggressive reductions in greenhouse gas emissions may substantially reduce but do not eliminate the risk to California of extreme sea-level rise from Antarctic ice loss."